

Using a mathematical model to analyze the role of probiotics and inflammation in necrotizing enterocolitis
- PMID: 20419099
- PMCID: PMC2856678
- DOI: 10.1371/journal.pone.0010066
Using a mathematical model to analyze the role of probiotics and inflammation in necrotizing enterocolitis
Abstract
Background: Necrotizing enterocolitis (NEC) is a severe disease of the gastrointestinal tract of pre-term babies and is thought to be related to the physiological immaturity of the intestine and altered levels of normal flora in the gut. Understanding the factors that contribute to the pathology of NEC may lead to the development of treatment strategies aimed at re-establishing the integrity of the epithelial wall and preventing the propagation of inflammation in NEC. Several studies have shown a reduced incidence and severity of NEC in neonates treated with probiotics (beneficial bacteria species).
Methodology/principal findings: The objective of this study is to use a mathematical model to predict the conditions under which probiotics may be successful in promoting the health of infants suffering from NEC. An ordinary differential equation model is developed that tracks the populations of pathogenic and probiotic bacteria in the intestinal lumen and in the blood/tissue region. The permeability of the intestinal epithelial layer is treated as a variable, and the role of the inflammatory response is included. The model predicts that in the presence of probiotics health is restored in many cases that would have been otherwise pathogenic. The timing of probiotic administration is also shown to determine whether or not health is restored. Finally, the model predicts that probiotics may be harmful to the NEC patient under very specific conditions, perhaps explaining the detrimental effects of probiotics observed in some clinical studies.
Conclusions/significance: The reduced, experimentally motivated mathematical model that we have developed suggests how a certain general set of characteristics of probiotics can lead to beneficial or detrimental outcomes for infants suffering from NEC, depending on the influences of probiotics on defined features of the inflammatory response.
Conflict of interest statement
Figures
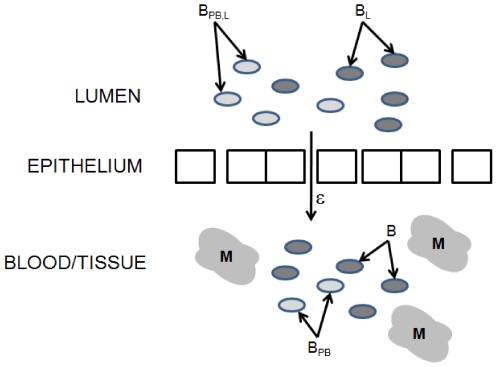
 pathogenic bacteria in the lumen.
  probiotic bacteria in the lumen.
  permeability of epithelial wall.
  pathogenic bacteria in the blood/tissue.
  probiotic bacteria in the blood/tissue.
  immune cells in the blood/tissue.
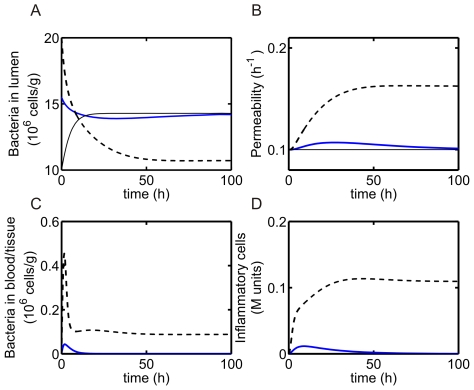
 cells/g (thin curve, health),
  cells/g (thick blue curve, health), and
  cells/g (dashed curve, disease). The growth rate of pathogenic bacteria is
  h
h and the threshold is
  cells/g/h. (A) Bacteria in lumen. (B) Permeability. (C) Bacteria in blood/tissue. (D) Inflammatory cells.
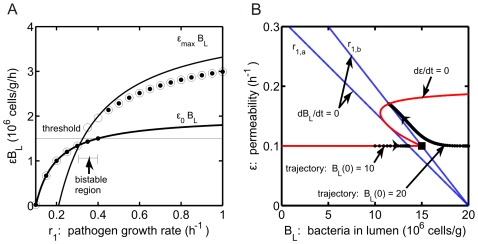
 ) is varied. Steady state solutions of
  are given by (
 ) for
) for  cells/g and (
 ) for
) for  cells/g. In the bistable region, steady state solutions are exactly
  or close to
  (curves labeled) depending on the initial level of pathogenic bacteria. Thin horizontal line: threshold,
  cells/g/h. (B)
  phase plane corresponding to system dynamics in panel A. A region of bistability is predicted when the
  (blue) and
  (red) nullclines intersect three times. This occurs for values of
  within
  (corresponding nullclines included). Trajectories for
  cells/g when
  h
h and
and  cells/g when
  h
h are also shown. The closed square gives the value of bacteria at which threshold is exceeded and bacteria are able to translocate into the blood/tissue.
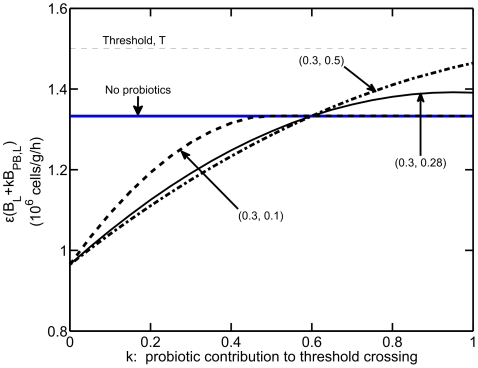
 (no probiotics, labeled). Thin, dashed line: threshold value, T. Steady state values of
  are shown for a small initial bacterial insult (
 cells/g) and the following parameter combinations:
  h
h and
and  h
h (dashed curve),
  h
h and
and  h
h (solid curve), and
  h
h and
and  h
h (dashed-dotted curve). Note, parameters are labeled as (
 ,
, ) on the figure.
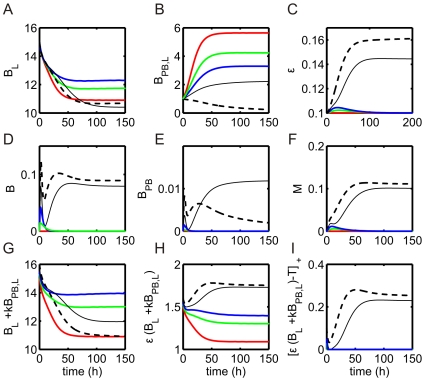
 is varied:
  (red),
  (green),
  (blue),
  (black), and
  (dashed). The system is simulated in the bistable region, with initial pathogenic bacteria insult
  cells/g, pathogenic bacteria growth rate
  h
h , and probiotic bacteria growth rate
  h
h . (A) Bacteria in lumen,
  . (B) Probiotic bacteria in lumen,
  . (C) Permeability,
  . (D) Bacteria in blood/tissue,
  . (E) Probiotic bacteria in blood/tissue,
  . (F) Immune cells,
  . (G) Total bacteria in lumen,
  . (H) Product of luminal bacteria and permeability,
  . (I) Difference between product in (H) and threshold,
  .
.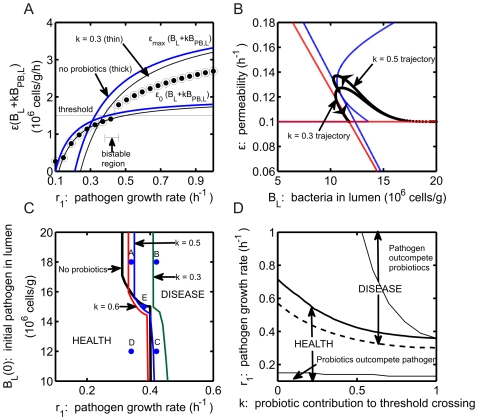
 ) is varied.
  and
and  curves in the presence (black line,
  ) and absence (blue line) of probiotics are included. Steady state values of
  , with
  , are given by (
 ) for
) for  cells/g and (
 ) for
) for  cells/g, as in Figure 3A. (B)
  phase plane (magnified) corresponding to system dynamics in panel A with
  cells/g. The
  and
and  nullclines are shown for
  (blue) and
  (red). Trajectories for
  and
and  (
( , labeled) indicate predicted disease and health states, respectively. (C) Predictions of health and disease for various initial numbers of pathogenic bacteria (
 ) and pathogenic bacteria growth rates. Thick, black curve: separates regions of health and disease in the absence of probiotics. Solid curves separate regions of health and disease in the presence of probiotics with
  g/cell and
  (red),
  (blue), and
  (green). System behavior is investigated at five points, A–E. (D) Predicted regions of health and disease are separated by a thick solid line and a dashed line, respectively, as parameters
  and
and  are varied. Bistability of stable health and disease states occurs for values of
  and
and  in the overlap of the health and disease regions. A summary of system dynamics is also included and separated by thin, solid curves.
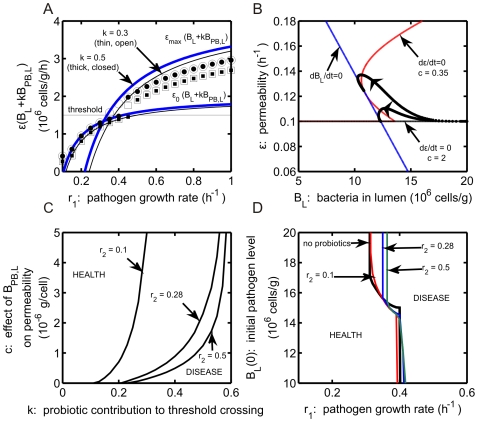
 values (parameter relating the probiotic contribution to threshold crossing) as the growth rate of pathogenic bacteria (
 ) is varied. Curves as in Figures 3A and 5A. Steady state solutions of
  are shown for
  cells/g (closed symbols) and
  cells/g (open symbols) with
  (circles) and
  (squares). (B)
  phase plane (magnified) as parameter
  is varied in the system. The
  (blue) and
  nullclines for
  g/cell (red) and
  (black) are shown. Trajectories (
 ) for both
  values are included. (C) Regions of health and disease predicted by the model as
  and
and  are varied. The system is initially in a disease state defined by
  cells/g and
  h
h . Combinations of
  and
and  values above each curve represents regions in which health is restored. Values of parameter
  is varied in the range in which probiotics are predicted to be beneficial:
  . Curves for different probiotic bacteria growth rates (
 ) are included:
  = 0.1, 0.28, and 0.5 h
 . (D) Effect of initial number of pathogenic bacteria (
 ) and probiotic bacteria growth rate (
 ) on predictions of health and disease is shown as
  is varied. Thick black curve: separates regions of health and disease in the absence of probiotics. The following curves separate regions of health and disease in the presence of probiotics with
  g/cell and
  :
:  h
h (red),
  h
h (blue), and
  (green).
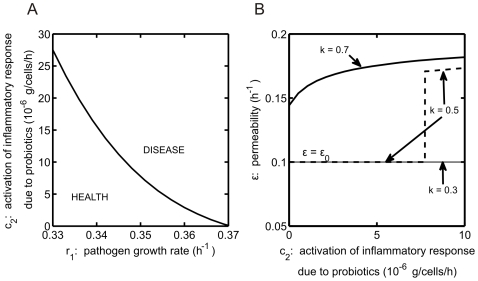
 (the activation of the inflammatory response due to the presence of probiotic bacteria in the blood/tissue) and
  (the growth rate of pathogenic bacteria) are varied. System is simulated in the bistable region, with initial pathogenic bacteria insult
  cells/g, probiotic contribution to threshold crossing
  , and probiotic bacteria growth rate
  h
h . (B) Effect of inflammatory response activation by probiotic bacteria (
 ) on the permeability of the intestinal wall (
 ). Baseline permeability is
  h
h . Parameter
  is varied:
  ,
,  , and
, and  (labeled).
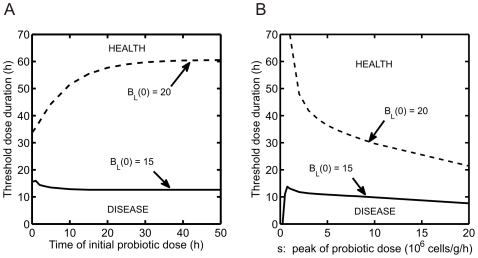
 cells/g/h) must be adminstered to result in health (defined as threshold dose duration). Two different initial bacteria levels are considered:
  cells/g (solid) and
  cells/g (dashed). In all simulations,
  g/cells and
  . (A) Change in the threshold dose duration for probiotic administration as the time of administration is varied. (B) Change in the threshold dose duration for probiotic administration as dose level (
 ) is increased.
References
-
- Claud EC, Walker WA. Bacterial colonization, probiotics, and necrotizing enterocolitis. J Clin Gastroenterol. 2008;42:S46–S52. - PubMed
-
- Guner YS, Friedlich P, Wee CP, Dorey F, Camerini V, et al. State-based anaylysis of necrotizing enterocolitis outcomes. J Surg Res. 2009;157:21–29. - PubMed
-
- Lin PW, Nasr TR, Stoll BJ. Necrotizing enterocolitis: Recent scientific advances in pathophysiology and prevention. Semin Perinatol. 2008;32(2):70–82. - PubMed
-
- Hunter CJ, Upperman JS, Ford HR, Camerini V. Understanding the susceptibility of the premature infant to necrotizing enterocolitis. Pediatr Res. 2008;63(2):117–123. - PubMed
Publication types
MeSH terms
Grants and funding
LinkOut - more resources
Full Text Sources
Other Literature Sources
