. 2010 Apr 15;6(4):e1000842.
doi: 10.1371/journal.ppat.1000842.

Increased monocyte turnover from bone marrow correlates with severity of SIV encephalitis and CD163 levels in plasma

Affiliations

Increased monocyte turnover from bone marrow correlates with severity of SIV encephalitis and CD163 levels in plasma

Tricia H Burdo et al. PLoS Pathog. .

Abstract

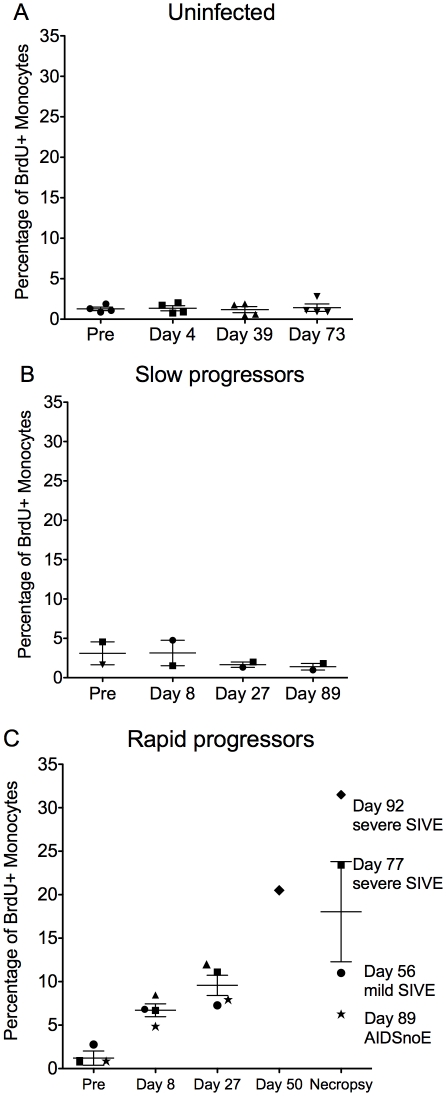
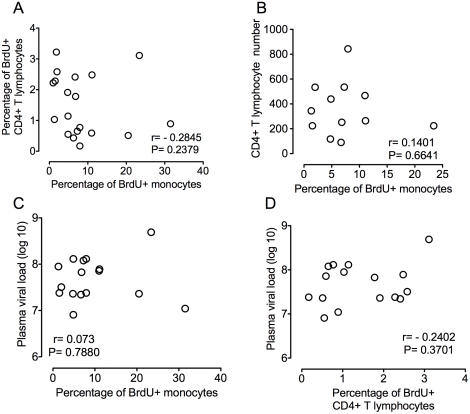
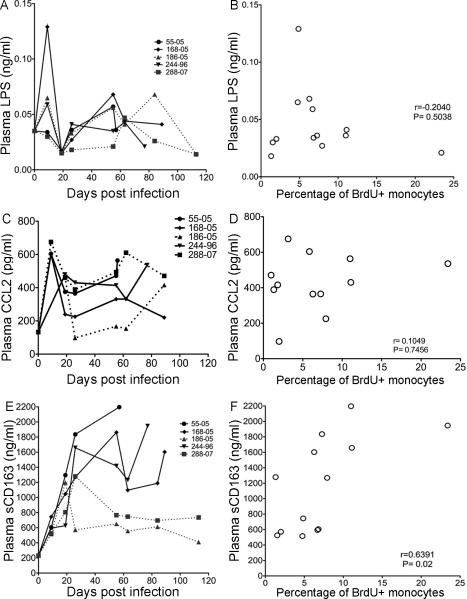
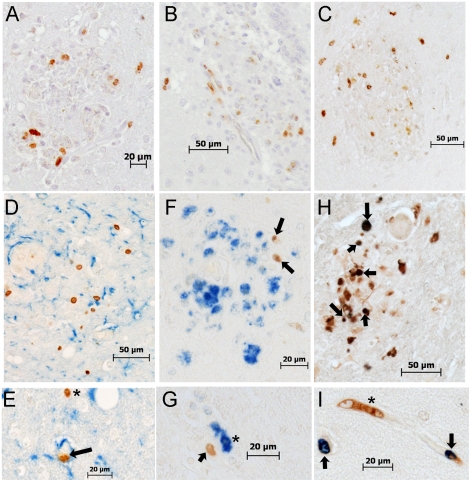
Cells of the myeloid lineage are significant targets for human immunodeficiency virus (HIV) in humans and simian immunodeficiency virus (SIV) in monkeys. Monocytes play critical roles in innate and adaptive immunity during inflammation. We hypothesize that specific subsets of monocytes expand with AIDS and drive central nervous system (CNS) disease. Additionally, there may be expansion of cells from the bone marrow through blood with subsequent macrophage accumulation in tissues driving pathogenesis. To identify monocytes that recently emigrated from bone marrow, we used 5-bromo-2'-deoxyuridine (BrdU) labeling in a longitudinal study of SIV-infected CD8+ T lymphocyte depleted macaques. Monocyte expansion and kinetics in blood was assessed and newly migrated monocyte/macrophages were identified within the CNS. Five animals developed rapid AIDS with differing severity of SIVE. The percentages of BrdU+ monocytes in these animals increased dramatically, early after infection, peaking at necropsy where the percentage of BrdU+ monocytes correlated with the severity of SIVE. Early analysis revealed changes in the percentages of BrdU+ monocytes between slow and rapid progressors as early as 8 days and consistently by 27 days post infection. Soluble CD163 (sCD163) in plasma correlated with the percentage of BrdU+ monocytes in blood, demonstrating a relationship between monocyte activation and expansion with disease. BrdU+ monocytes/macrophages were found within perivascular spaces and SIVE lesions. The majority (80-90%) of the BrdU+ cells were Mac387+ that were not productively infected. There was a minor population of CD68+BrdU+ cells (<10%), very few of which were infected (<1% of total BrdU+ cells). Our results suggest that an increased rate of monocyte recruitment from bone marrow into the blood correlates with rapid progression to AIDS, and the magnitude of BrdU+ monocytes correlates with the severity of SIVE.


Conflict of interest statement

The authors have declared that no competing interests exist.

Figures

Figure 1
Figure 1. Gating strategy for identifying BrdU+ monocytes.
In order to identify BrdU+ monocytes after in vivo BrdU injection, we used flow cytometry on whole blood. We first gated on the monocytes based on their forward (FSC) vs. side scatter (SSC) properties (far left panel), then excluded HLA-DR negative cells as well as T-lymphocytes using anti-CD3, NK cells using anti-CD8 and B-lymphocytes using anti-CD20 (second panel from left). Next, we examined monocytes based on their expression of CD14 and CD16 (right top panel). We examined the expression of Ki-67 and BrdU on monocytes (including CD14+CD16−, CD14+CD16+ and CD14−CD16+) (bottom right panel). For the purpose of this study, CD14−CD16− cells were excluded from all further analyses since this population contains CD34+ hematopoietic stem cells and dendritic cells (bottom left panel). This gating and data are representative of an infected rapid progressor at day 27 post-infection out of all animals studied.
Figure 2
Figure 2. Increased percentage of BrdU+ monocytes is predictive rapid progression to AIDS and severity of SIVE.
(A–C): BrdU was injected prior to (n = 1) and after SIVmac251 infection (n = 3) and the percentages of BrdU+ monocytes 24hrs after BrdU injection was determined by flow cytometric analysis. A. In four uninfected CD8+ T lymphocyte depleted animals, the percentage of BrdU+ monocytes remained approximately 2% of total monocytes in all time points. Thus, CD8+ T lymphocyte depletion alone without SIV infection does not alter monocyte turnover (n = 4). CD8+ T lymphocyte depleted SIV infected animals were divided into two groups: slow progressors (B) and rapid progressors (C). B. Monocyte turnover is unchanged at all points examined after infection in slow progressors (n = 2). C. The percentages of BrdU+ monocytes increased dramatically with rapid disease in animals that succumbed to AIDS (n = 5). The magnitude of BrdU+ incorporation of monocytes at necropsy can differentiate mild and severe SIVE. Each animal is represented by a different symbol. Error bars are standard error of the mean.
Figure 3
Figure 3. Percentage of BrdU+ monocytes does not correlate with plasma virus or CD4+ T lymphocyte turnover or numbers.
A. Paired XY values for percentage of BrdU incorporation in CD4+ T lymphocytes and monocytes in all infected animals are plotted. No correlation is found between the percentage of BrdU+ monocytes and the percentage of BrdU+ CD4+ T lymphocytes (P = 0.2379). B. Paired XY values for percentage of BrdU incorporation monocytes and CD4+ T lymphocyte counts in all seven infected animals are plotted. No correlation is found between the percentage of BrdU+ monocytes and CD4+ T cell counts (P = 6641). C. Paired XY values for percentage of monocyte BrdU incorporation and plasma viral load in all infected animals are plotted. No correlation is found between the percentage of BrdU+ monocytes and plasma viral loads P = 7880. D. Paired XY values for percentage of BrdU+ CD4+ T cells and plasma virus in all infected animals are plotted. No correlation is found between the percentage of BrdU+ CD4+ T cells and plasma viral loads P = 0.3701. A Spearman rank test is used for statistics.
Figure 4
Figure 4. Monocyte subsets leave the bone marrow at different rates that are accelerated in animals that develop SIVE.
BrdU was injected four times over the course of the study. Red = pre-infection (days −10 days post infection (dpi)), Blue = peak infection (7 dpi), Green = “asymptomatic” period (26 dpi) and Black = 88 dpi (slow progressors = A–B) or necropsy (rapid progressors = C–D). BrdU injections were given at 24hrs before necropsy. The percentage of BrdU+ monocytes in each subset was determined 24hr and 48hr and either 96 or 120 hrs after BrdU injection (Time: 0 hr). (A–B) Dots represent the averages of the percentage of BrdU+ cells in the subsets of slow progressors that remained asymptomatic throughout the period examined. A. There is no change in the percentage of BrdU+ CD14+CD16− cells between pre- and post-infection time points. B. There is a slight increase in the percentage of BrdU+ CD14+CD16+cells after infection that is apparent at 48hrs. (C–D) Dots are averages from two rapid progressors (244-96 and 55-05). The percentage of BrdU+ monocytes was only examined 24hrs after BrdU pulse for animals, DB79 and CM07. C. The difference in the percentage of BrdU+CD14+CD16− cells between pre- and post-infection is apparent at 24hrs. D. The difference in the percentage of BrdU+ CD14+CD16+cells between pre- and post-infection occurs at 48hrs. The error in all graphs is the standard error of the mean.
Figure 5
Figure 5. sCD163 levels in plasma, but not LPS or CCL2, correlates with percentage of BrdU+ in total monocytes.
A. LPS plasma levels in the individual SIV infected animals after infection are shown. Solid lines are plasma LPS levels in rapid progressors. Dashed lines are plasma LPS levels in slow progressors. B. There is no correlation between plasma LPS levels with the percentage of BrdU+ monocytes. C. CCL2/MCP-1 plasma levels in individual SIV infected animals after infection are shown. The solid lines represent plasma CCL2/MCP-1 levels in rapid progressors. The dashed lines represent plasma CCL2/MCP-1 levels in slow progressors. D. There is no correlation between plasma CCL2/MCP-1 and the percentage of BrdU+ monocytes. E. sCD163 plasma levels in individual SIV infected animals after infection are shown. Solid lines are sCD163 plasma in rapid progressors. Dashed lines are sCD163 plasma in slow progressors. F. There is a significant correlation between sCD163 plasma levels and percentage of BrdU+ monocytes. The Spearman rank test is used.
Figure 6
Figure 6. Histopathologic studies showed evidence of BrdU+ cells, the majority of which are Mac387+, in the brains of macaques with SIVE.
A–B: Immunohistochemistry with an antibody against BrdU is utilized in brain sections of rapid progressors. A: BrdU+ cells are present in and around SIVE lesions (BrdU: DAB, brown) B: BrdU+ cells are seen in and around the vasculature (BrdU: DAB, brown) C: Immunohistochemistry with antibodies against CD3 (Vector Blue, blue) and BrdU (DAB, brown) is utilized in brain sections of rapid progressors to examine if BrdU+ cells are CD4+ T lymphocytes. No double label BrdU+ and CD3+ cells are found in the brains of SIVE+ macaques. D and E: Immunohistochemistry with antibodies against GFAP (Vector Blue, blue) and BrdU (DAB, brown) is utilized in brain sections of rapid progressors to examine if BrdU+ cells are astrocytes. There are very few BrdU+ astrocytes seen in all sections examined. The arrow points to a BrdU+ in a vessel surrounded by astrocyte foot processes. The asterisk points out a BrdU+ cells in close proximity to GFAP+ astrocytes. F and G: Immunohistochemistry with antibodies against CD68 (DAB, brown) and BrdU (Vector Blue, blue) is utilized in brain sections of rapid progressors to examine if BrdU+ cells were CD68+ mature macrophages. Few BrdU+CD68+ cells are seen. H and I: Double staining with antibodies against BrdU (Vector Blue, blue) and Mac387 (DAB, brown) is utilized to determine if BrdU+ cells in the brain are early monocyte/macrophage infiltrates. BrdU and Mac387 did co-localization in the brain of SIVE animals. The arrows indicate BrdU+Mac387+ monocyte/macrophages, in a lesion (H) or perivascular region (I). The asterisk is a Mac387 BrdU- cell in the vasculature. Brain sections are representative of three SIVE+ animals examined for all stains.
Figure 7
Figure 7. The majority of BrdU+ monocyte/macrophages in the brain are not productively infected.
Triple label with antibodies against BrdU (red), SIV p28 (green), CD68 (blue) is used to determine if BrdU+ cells are productively infected. Side panels are single-color images of SIVp28 (green), BrdU (red), CD68 (blue) and differential interference contrast (DIC). A: BrdU+ (red) cells in blood vessels and a BrdU+ cell infiltrated in the brain B–D: Multiple BrdU+ cells are detected in and around SIVE lesion. B: BrdU+ cells are seen in and around this SIVE lesion; the majority BrdU+ cells are SIV p28− and thus not productively infected. C: The majority of the BrdU+ cells in lesions are Mac387+. Double label with antibodies against BrdU (blue) and Mac387 (brown) in an SIVE lesion is shown. D: An SIVE lesion in the brain of a rapid progressor showing a rare triple positive cell: SIV-infected CD68+BrdU+ macrophage (white arrow). Data presented here are representative of n = 3 macaques with SIVE. Multiple tissue sections from different brain regions were examined.

References

    1. Soulas C, Donahue RE, Dunbar CE, Persons DA, Alvarez X, et al. Genetically modified CD34+ hematopoietic stem cells contribute to turnover of brain perivascular macrophages in long-term repopulated primates. Am J Pathol. 2009;174:1808–1817. - PMC - PubMed
    1. Gonzalez-Mejia ME, Doseff AI. Regulation of monocytes and macrophages cell fate. Front Biosci. 2009;14:2413–2431. - PubMed
    1. van Furth R. Origin and turnover of monocytes and macrophages. Curr Top Pathol. 1989;79:125–150. - PubMed
    1. Tushinski RJ, Oliver IT, Guilbert LJ, Tynan PW, Warner JR, et al. Survival of mononuclear phagocytes depends on a lineage-specific growth factor that the differentiated cells selectively destroy. Cell. 1982;28:71–81. - PubMed
    1. Landsman L, Varol C, Jung S. Distinct differentiation potential of blood monocyte subsets in the lung. J Immunol. 2007;178:2000–2007. - PubMed

Publication types

MeSH terms