

MRI-determined fat content of human liver, pancreas and kidney
- PMID: 20419836
- PMCID: PMC2860076
- DOI: 10.3748/wjg.v16.i16.1993
MRI-determined fat content of human liver, pancreas and kidney
Abstract
Aim: To assess and correlate the lipid content of various organs in obese subjects and in persons with a normal body weight.
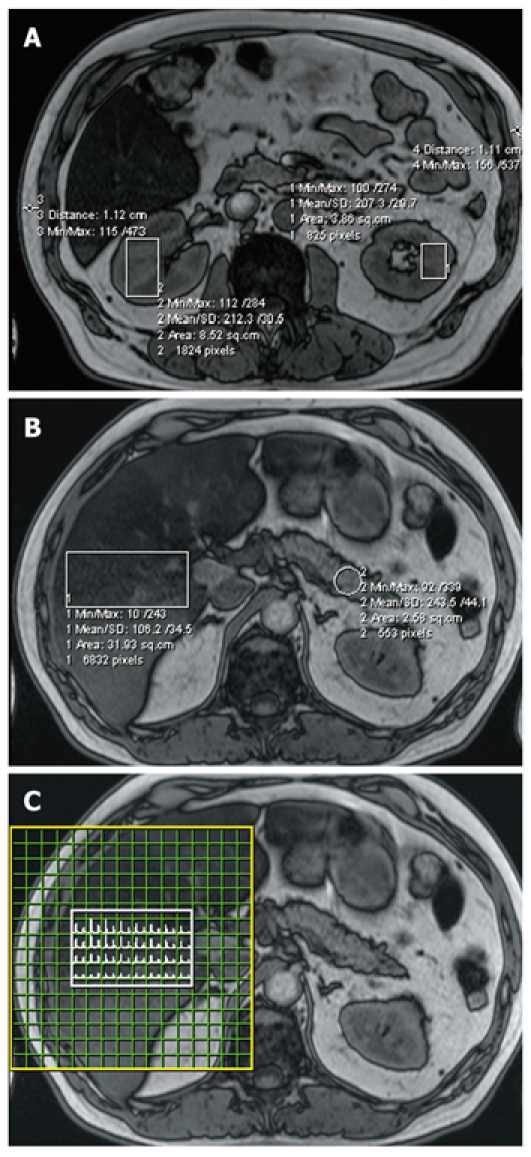
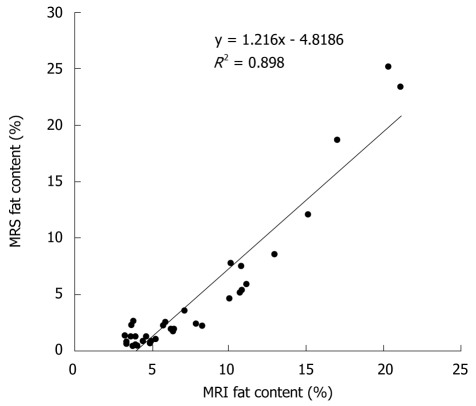
Methods: Magnetic resonance spectroscopy and a previously validated gradient echo magnetic resonance imaging method with Dixon's two point technique were used in this study to quantify fat in liver, pancreas as well as kidney.
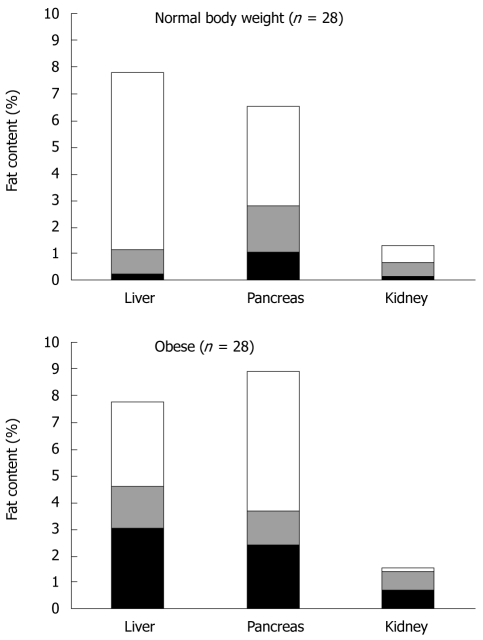
Results: In 36 volunteers with body mass index (BMI) ranging from 20.0 to 42.9 kg/m(2), the median fat content of liver, pancreas and kidney was 2.3% (interquartile range: 0.2%-7.8%), 2.7% (1.0%-6.5%) and 0.7% (0.1%-1.4%), respectively. BMI and subcutaneous fat correlated significantly with liver and pancreas fat content. We show for the first time the significant correlation of liver and pancreas fat content in healthy controls (r = 0.43, P < 0.01). These observations are related to body weight as measured by BMI and the amount of subcutaneous fat. Kidney fat content is very low and correlates with none of the other fat depots.
Conclusion: Renal lipid accumulation, unlike the coupled accumulations of fat in liver and pancreas, is not observed in obese subjects. Unlike suggestions made in previous studies, renal lipid accumulation appears not to be involved in the pathogenesis of renal disease in humans.
Figures
References
-
- Snijder MB, van Dam RM, Visser M, Seidell JC. What aspects of body fat are particularly hazardous and how do we measure them? Int J Epidemiol. 2006;35:83–92. - PubMed
-
- Unger RH. Minireview: weapons of lean body mass destruction: the role of ectopic lipids in the metabolic syndrome. Endocrinology. 2003;144:5159–5165. - PubMed
-
- Kotronen A, Yki-Järvinen H. Fatty liver: a novel component of the metabolic syndrome. Arterioscler Thromb Vasc Biol. 2008;28:27–38. - PubMed
-
- Wahba IM, Mak RH. Obesity and obesity-initiated metabolic syndrome: mechanistic links to chronic kidney disease. Clin J Am Soc Nephrol. 2007;2:550–562. - PubMed
-
- Weinberg JM. Lipotoxicity. Kidney Int. 2006;70:1560–1566. - PubMed
MeSH terms
Substances
LinkOut - more resources
Full Text Sources
Medical
