

Safety, tolerability, and mechanisms of antiretroviral activity of pegylated interferon Alfa-2a in HIV-1-monoinfected participants: a phase II clinical trial
- PMID: 20420510
- PMCID: PMC2946345
- DOI: 10.1086/652420
Safety, tolerability, and mechanisms of antiretroviral activity of pegylated interferon Alfa-2a in HIV-1-monoinfected participants: a phase II clinical trial
Abstract
Background: To our knowledge, the antiviral activity of pegylated interferon alfa-2a has not been studied in participants with untreated human immunodeficiency virus type 1 (HIV-1) infection but without chronic hepatitis C virus (HCV) infection.
Methods: Untreated HIV-1-infected volunteers without HCV infection received 180 microg of pegylated interferon alfa-2a weekly for 12 weeks. Changes in plasma HIV-1 RNA load, CD4(+) T cell counts, pharmacokinetics, pharmacodynamic measurements of 2',5'-oligoadenylate synthetase (OAS) activity, and induction levels of interferon-inducible genes (IFIGs) were measured. Nonparametric statistical analysis was performed.
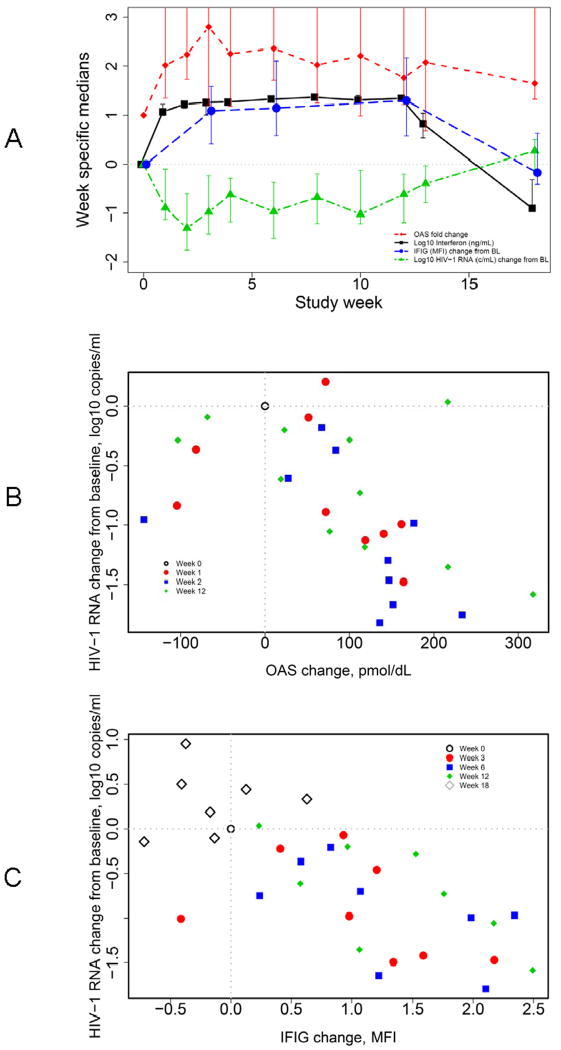
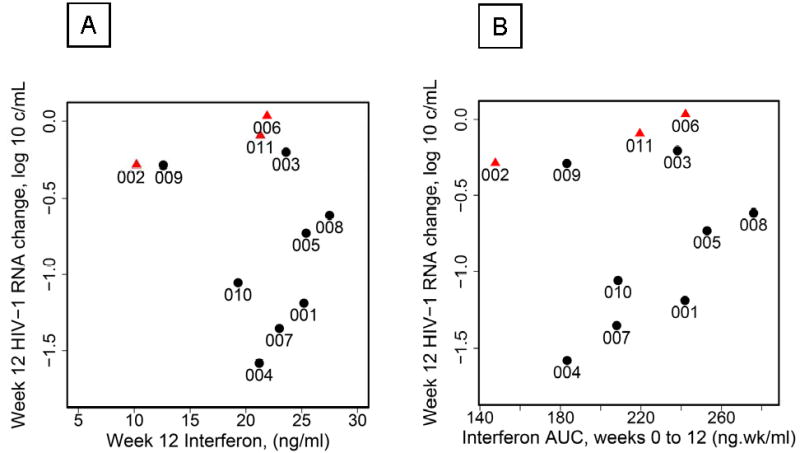
Results: Eleven participants completed 12 weeks of therapy. The median plasma viral load decrease and change in CD4(+) T cell counts at week 12 were 0.61 log(10) copies/mL (90% confidence interval [CI], 0.20-1.18 log(10) copies/mL) and -44 cells/microL (90% CI, -95 to 85 cells/microL), respectively. There was no correlation between plasma viral load decreases and concurrent pegylated interferon plasma concentrations. However, participants with larger increases in OAS level exhibited greater decreases in plasma viral load at weeks 1 and 2 (r = -0.75 [90% CI, -0.93 to -0.28] and r = -0.61 [90% CI, -0.87 to -0.09], respectively; estimated Spearman rank correlation). Participants with higher baseline IFIG levels had smaller week 12 decreases in plasma viral load (0.66 log(10) copies/mL [90% CI, 0.06-0.91 log(10) copies/mL]), whereas those with larger IFIG induction levels exhibited larger decreases in plasma viral load (-0.74 log(10) copies/mL [90% CI, -0.93 to -0.21 log(10) copies/mL]).
Conclusion: Pegylated interferon alfa-2a was well tolerated and exhibited statistically significant anti-HIV-1 activity in HIV-1-monoinfected patients. The anti-HIV-1 effect correlated with OAS protein levels (weeks 1 and 2) and IFIG induction levels (week 12) but not with pegylated interferon concentrations.
Trial registration: ClinicalTrials.gov NCT00078442.
Conflict of interest statement
Potential conflicts of interest. No authors have any conflicts to report.
Figures


References
-
- Biron CA. Role of early cytokines, including alpha and beta interferons (IFN-alpha/beta), in innate and adaptive immune responses to viral infections. Semin Immunol. 1998;10(5):383–90. - PubMed
-
- Knop J. Immunologic effects of interferon. J Invest Dermatol. 1990;95(6 Suppl):72S–4S. - PubMed
-
- Le Bon A, Etchart N, Rossmann C, et al. Cross-priming of CD8+ T cells stimulated by virus- induced type I interferon. Nat Immunol. 2003;4(10):1009–15. - PubMed
-
- Nokta MA, Reichman RC, Pollard RB. Pathogenesis of Viral Infections. In: Galasso GJ, Whitley RJ, Merigan TC, editors. Antiviral Agents and Viral Diseases of Man. Third. New York: Raven Press; 1990. pp. 49–85.
Publication types
MeSH terms
Substances
Associated data
Grants and funding
LinkOut - more resources
Full Text Sources
Other Literature Sources
Medical
Research Materials
