Comparative Study
. 2010 Aug 15;52(2):415-28.
doi: 10.1016/j.neuroimage.2010.04.238. Epub 2010 Apr 24.

Atlas-based analysis of neurodevelopment from infancy to adulthood using diffusion tensor imaging and applications for automated abnormality detection

Affiliations
Comparative Study

Atlas-based analysis of neurodevelopment from infancy to adulthood using diffusion tensor imaging and applications for automated abnormality detection

Andreia V Faria et al. Neuroimage. .

Abstract

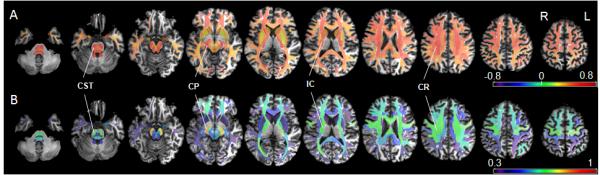
Quantification of normal brain maturation is a crucial step in understanding developmental abnormalities in brain anatomy and function. The aim of this study was to develop atlas-based tools for time-dependent quantitative image analysis, and to characterize the anatomical changes that occur from 2years of age to adulthood. We used large deformation diffeomorphic metric mapping to register diffusion tensor images of normal participants into the common coordinates and used a pre-segmented atlas to segment the entire brain into 176 structures. Both voxel- and atlas-based analyses reported a structure that showed distinctive changes in terms of its volume and diffusivity measures. In the white matter, fractional anisotropy (FA) linearly increased with age in logarithmic scale, while diffusivity indices, such as apparent diffusion coefficient (ADC), and axial and radial diffusivity, decreased at a different rate in several regions. The average, variability, and the time course of each measured parameter are incorporated into the atlas, which can be used for automated detection of developmental abnormalities. As a demonstration of future application studies, the brainstem anatomy of cerebral palsy patients was evaluated and the altered anatomy was delineated.


Figures

Figure 1
Figure 1
Schematic diagram of the image normalization process. The two images in the boxes framed in blue are initial images for the image analysis; the subject original MRI and the atlas with the white matter parcellation map (WMPM). For the “forward” transformation, the subject image was first linearly normalized (affine transformation) followed by non-linear normalization (LDDMM). After this procedure, all subject images were transformed to a shape similar to that of the atlas. For the “backward” transformation, the WMPM was transformed to the original MRI using the same deformation fields used for the forward transformation. This allows automated segmentation of the original images into 130 subregions. For cortical areas where there is a large amount of anatomical variability, the cortex and the white matter were further divided using a threshold (FA > 0.25) for each subject, resulting in a total of 176 subregions. The final images used for statistical analyses are framed by red boxes.
Figure 2
Figure 2
Demonstration of the normalization process and accuracy. (A) The Eve atlas used as the normalization target image. (B) A subject image warped to the atlas using the linear normalization. (C) A subject image after LDDMM normalization. Structures that are not accurately registered after the linear transformation are indicated by arrows, which are well-registered after LDDMM. (D) The final segmentation of the cortex and the associated white matter using an FA threshold (0.25).
Figure 3
Figure 3
Scatterplots of the volume of total brain tissue, CSF, white matter, and gray matter compartments as a function of age. The data are fitted by a linear model except for the gray matter, which is modeled by an equation: volume = intercept + β1 *age + β2 *age2. The orientation of the slices follows the radiological convention (L=left, R=right).
Figure 4
Figure 4
Three-dimensional views of the atlas-based results overlaid in the rendered brain surface from the JHU-DTI-MNI single-subject Atlas (deepness of ROI visualization=100%). Colors represent the slope of the linear fitting between age (measured in years, in logarithmic scale) and volume (A); FA (B); and ADC (C) in each region. Regions with an R2 > 0.3 are visualized. In many regions, the volume and the FA increase with age (except for FA in some cortical regions) while ADC decreases with age.
Figure 5
Figure 5
Maps of slopes (A) and R2s (B) of the volumes measured by the atlas-based analysis. Larger, positive, time-dependence is observed in the white matter that contains projection fibers, such as in the corticospinal tract at the pons level (CST), the cerebral peduncles (CP), the internal capsulas (IC), and the corona radiata (CR). The orientation of the slices follows the radiological convention (L=left, R=right). Slice positions are z = −55, −45, −35, −25, −15, −5, 5, 15, 25, and 35.
Figure 6
Figure 6
Actual fitting results (volume (mm3) vs. age (years, logarithmic scale)) at representative locations with high (upper row) and low (bottom row) time-dependence. The orientation of the slices follows the radiological convention (L=left, R=right). Slice positions are z = −30, −15, 0, and 25.
Figure 7
Figure 7
Maps of slopes (A) and R2 (B) of the FA measured by the atlas-based analysis. A larger, positive, time-dependence is observed in the brainstem WM, the thalamus (Th), the anterior limb of the internal capsules (IC), and the frontal and parietal WM (FWM and PWM, respectively). Some cortical areas have negative time-dependence. The orientation of the slices follows the radiological convention (L=left, R=right). Slice positions are z = −55, −45, −35, −25, −15, −5, 5, 15, 25, and 35.
Figure 8
Figure 8
Map of slopes (A, B and C) and R2 (D, E and F) of ADC, λ. and λ respectively, measured by the atlas–based analysis. Most white matter regions show a significant decrease in all three diffusivity measures. Regions such as the corticospinal tract (CST), the cerebral peduncles (CP), and the superior longitudional fasciculus (SLF) showed significant time-dependence of λ ,but of λ. The orientation of the slices follows the radiological convention (L=left, R=right). Slice positions are z = −55, −45, −35, −25, −15, −5, 5, 15, 25, and 35 .
Figure 9
Figure 9
Actual fitting results for the FA (first line), ADC (second line, in mm2/s), λ, and λ (third line, in mm2/s) values by age (in years, logarithmic scale) at representative locations. In the corticospinal tract (CST, first column), the FA increase can be explained by the λ decrease. In the anterior corona radiata (ACR, second column), the age-related changes in the λ cause a weaker time-dependent FA change. In the WM of the superior occiptal gyrus (SOG, third column), the parallel decreases in both λ, and λ⊥ lead to no significant changes in FA. The orientation of the slices follows the radiological convention (L=left, R=right). Slice positions are z = −58, −8, and 13.
Figure 10
Figure 10
Map of slopes measured by the voxel- (A) and atlas-based analyses (B) for the volume, FA, and diffusivity values. Note the overall agreement between the two methods. Th=Thalamus. The orientation of the slices follows the radiological convention (L=left, R=right). Slice positions are z = −58, −30, −13, 2, and 24.
Figure 11
Figure 11
Demonstration of automated abnormality detection using the atlas enriched by a normal database of developing brains. (A) FA maps of one control and three CP patients at the pons level (z = −57), revealing the CST, FA, and volume Z-score maps that show the degree of deviation from control values. These maps are shown in the atlas space, with which abnormal WM tracts can be identified at a glance. (B) Actual data in the enriched atlas (green dots), and the values from 13 CP patients (yellow squares) for the FA and volume. Linear regression of FA and volume of the left corticospinal tract (arrows) of normal subjects are shown by green dots. Shaded area is 95% confidence interval of the curve and dashed lines are the prediction interval for z-scores of +/−2 (gray and red lines, respectively), −3 (blue line), and −4 (yellow line). Yellow squares are the results from CP patients. The color surrounding the images and circle colors in the scatterplots identify the subjects.

References

    1. Alexander AL, Lee JE, Lazar M, Field AS. Diffusion tensor imaging of the brain. NeuroTherapeutics. 2007;4(3):316–329. - PMC - PubMed
    1. Andersson JL, Skare S. A model-based method for retrospective correction of geometric distortions in diffusion-weighted EPI. NeuroImage. 2002;16(1):177–199. - PubMed
    1. Armand J, Olivier E, Edgley SA, Lemon RN. Postnatal development of corticospinal projections from motor cortex to the cervical enlargement in the macaque monkey. The Journal of Neuroscience. 1997;17(1):251–266. - PMC - PubMed
    1. Ballesteros MC, Hansen PE, Soila K. MR imaging of the developing human brain. Part 2. Postnatal development. Radiographics. 1993;13(3):611–622. - PubMed
    1. Baratti C, Barnett AS, Pierpaoli C. Comparative MR imaging study of brain maturation in kittens with T1, T2, and the trace of the diffusion tensor. Radiology. 1999;210(1):133–142. - PubMed

Publication types

MeSH terms