. 2010 Sep;38(16):5456-71.
doi: 10.1093/nar/gkq286. Epub 2010 Apr 26.

PIAS1 regulates CP2c localization and active promoter complex formation in erythroid cell-specific alpha-globin expression

Affiliations

PIAS1 regulates CP2c localization and active promoter complex formation in erythroid cell-specific alpha-globin expression

Ho Chul Kang et al. Nucleic Acids Res. 2010 Sep.

Abstract

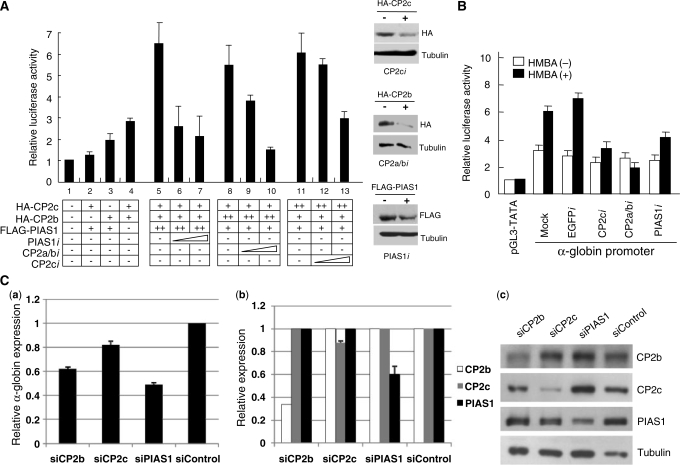
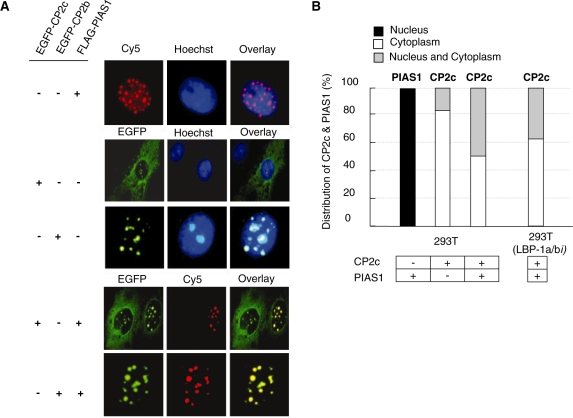
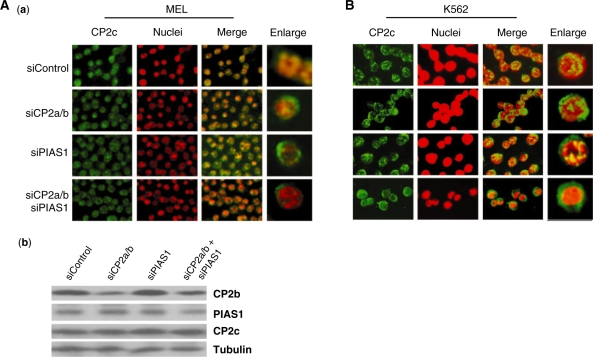
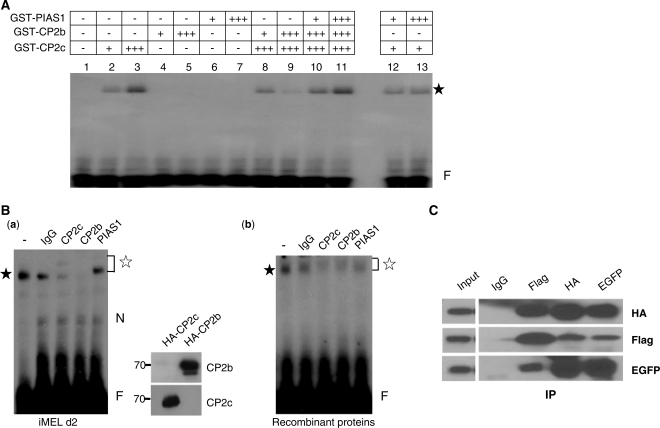
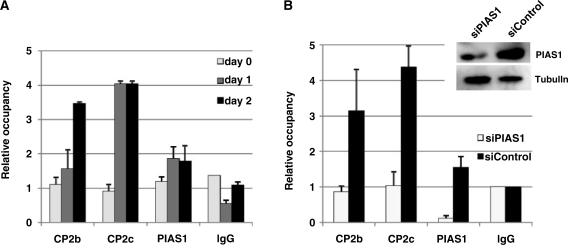
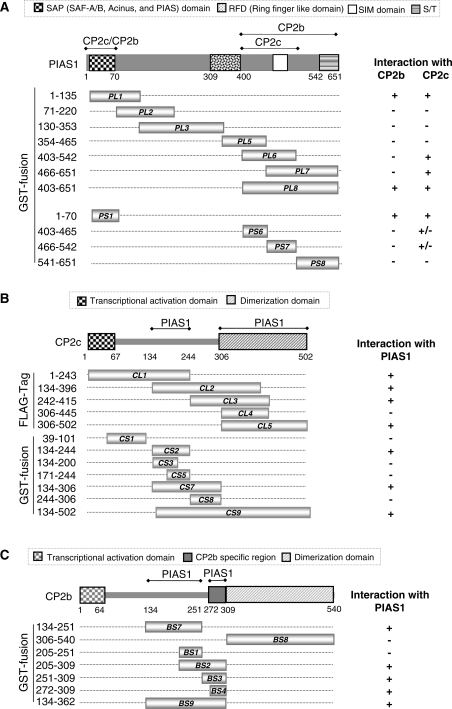
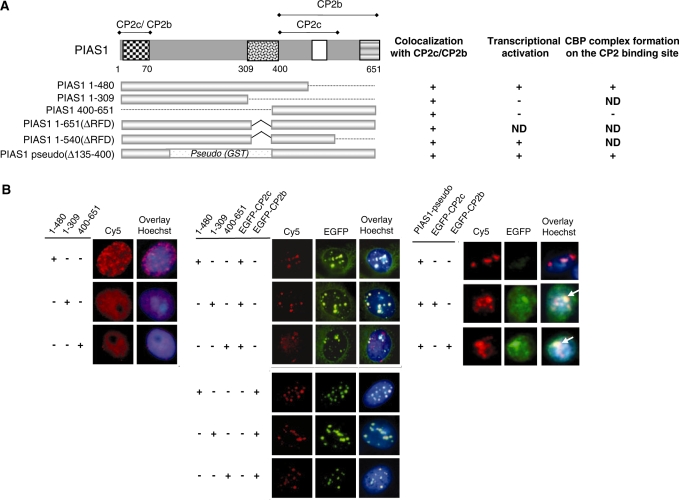
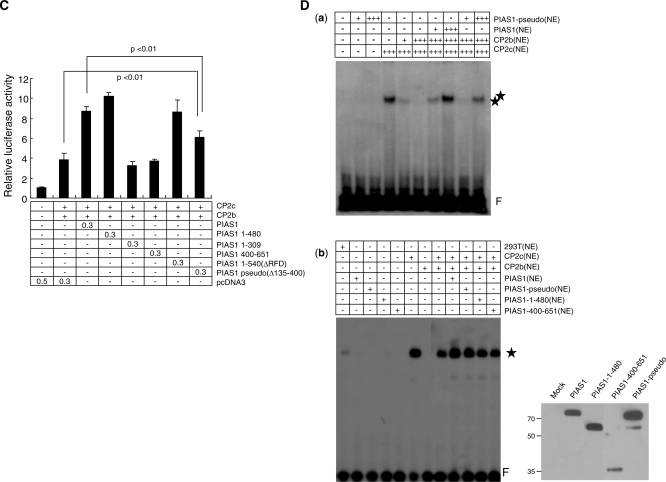
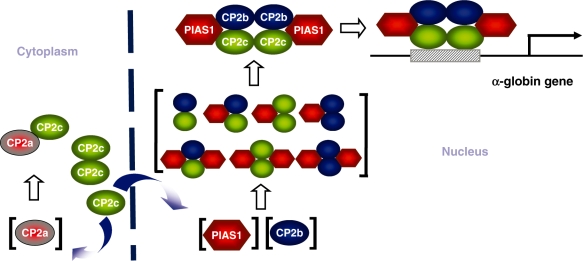
Data presented here extends our previous observations on α-globin transcriptional regulation by the CP2 and PIAS1 proteins. Using RNAi knockdown, we have now shown that CP2b, CP2c and PIAS1 are each necessary for synergistic activation of endogenous α-globin gene expression in differentiating MEL cells. In this system, truncated PIAS1 mutants lacking the ring finger domain recruited CP2c to the nucleus, as did wild-type PIAS1, demonstrating that this is a sumoylation-independent process. In vitro, recombinant CP2c, CP2b and PIAS1 bound DNA as a stable CBP (CP2c/CP2b/PIAS1) complex. Following PIAS1 knockdown in MEL cells, however, the association of endogenous CP2c and CP2b with the α-globin promoter simultaneously decreased. By mapping the CP2b- and CP2c-binding domains on PIAS1, and the PIAS1-binding domains on CP2b and CP2c, we found that two regions of PIAS1 that interact with CP2c/CP2b are required for its co-activator function. We propose that CP2c, CP2b, and PIAS1 form a hexametric complex with two units each of CP2c, CP2b, and PIAS1, in which PIAS1 serves as a clamp between two CP2 proteins, while CP2c binds directly to the target DNA and CP2b mediates strong transactivation.


Figures

Figure 1.
Figure 1.
CP2c, CP2b and PIAS1 are essential for maximal upregulation of α-globin expression in erythroid cells. (A) K562 cells were transiently transfected with a luciferase reporter vector driven by the mouse α-globin promoter along with expression vectors, as indicated. At 48 h after transfection, whole cell lysates were prepared, and firefly and Renilla luciferase activities were measured simultaneously. Average values and standard deviations were obtained from three independent experiments. One-tenth (20 μg) of each whole cell extract was analyzed on a western blot with anti-FLAG or anti-HA antibody, and with β-tubulin as a control. (B) A reporter vector containing the α-globin promoter was transiently cotransfected with RNAi expression vectors specific for EGFP, CP2c, CP2a/b or PIAS1 into MEL cells in the absence or presence of 5 mM HMBA, as indicated. Each value was measured, as described in (A). (C) Effects of knockdown of endogenous CP2b, CP2c or PIAS1 on α-globin gene induction in differentiating MEL cells. MEL cells were transfected with siRNAs specific for CP2b, CP2c or PIAS1 (siCP2b, siCP2c and siPIAS1) and control siRNA (siControl). After 24 h of HMBA treatment, total RNA was isolated and analyzed by real-time qRT-PCR. (a) Expression of the α-globin gene relative to that of the GAPDH gene is shown. Values were normalized to results obtained from cells transfected with an siControl. Gene-specific decreases in expression corresponding to each siRNA were confirmed at the levels of mRNA and protein, using real-time qRT-PCR (b) and western blotting (c). Expression of CP2b, CP2c and PIAS1 genes relative to that of the GAPDH gene are shown, with values normalized as in (a). (c) Proteins (10 μg) were analyzed on western blots with anti-CP2b, anti-CP2c, anti-PIAS1 and anti-tubulin antibodies (as a control).
Figure 2.
Figure 2.
PIAS1 enhances the nuclear translocation of CP2c in a CP2b-independent manner. (A) 293T cells were transfected with pcDNA3-FLAG-PIAS1, pEGFPN1-CP2c or pEGFPN1-CP2b vectors, individually or in combination, as indicated. The FLAG-PIAS1 fusion proteins were detected with FLAG antibody followed by incubation with a Cy5-conjugated secondary antibody (red). (B) 293T or 293T (LBP-1a/bi) cells were transfected with pcDNA3-FLAG-PIAS1, or pEGFPN1-CP2c vectors, individually or in combination, as indicated. The subcellular distribution patterns of PIAS1 or CP2c were analyzed by scoring about 500 cells showing EGFP or FLAG expression and classifying individual cells into one of three groups, depending on its location (nucleus, cytoplasm or nucleus and cytoplasm).
Figure 3.
Figure 3.
The localization of CP2c in MEL (A) and K562 (B) cells in which the endogenous PIAS1 and/or CP2a/b were knocked down using siRNAs. (A) MEL cells were transfected with siRNAs specific for CP2a/b, or PIAS1 (siCP2a/b, and siPIAS1) and control siRNA (siControl). (a) After treatment with HMBA for 24 h, cells were harvested, attached to glass slides using cytospin and analyzed for CP2c by immunocytochemistry. Nuclei were identified by Hoechst 33258 staining. (b) An aliquot of each cell preparation (a) was analyzed via western blot to confirm protein levels following knockdown. (B) K562 cells were transfected with the same siRNAs shown in (A) and analyzed for CP2c by immunocytochemistry.
Figure 4.
Figure 4.
PIAS1 enhances the DNA-binding ability of the CP2c/CP2b complex. (A) GST-PIAS1 and GST-CP2 isoforms purified from bacteria were used in EMSA. For EMSA, each protein, individually or in combination, was incubated with the 32P-labeled DNA probe for consensus CP2 binding sites derived from the mouse α-globin promoter, as indicated in ‘Materials and Methods’ section. An asterisk indicates the protein–DNA complex. A plus sign (+) indicates 0.2 µg protein. (B) MEL cell nuclear extracts at differentiation Day 2 (a) or purified bacterial GST-CBP proteins (CP2c/CP2b/PIAS1) (b) were used in supershift EMSA assays. Mock assay (lane 1) and assays in which 3 μg IgG, anti-CP2c, anti-CP2b or anti-PIAS1 antibody was added to the reaction mixtures shown in (A) (lanes 2–5). The closed and open asterisks indicate the specific protein–DNA and supershifted protein–DNA complexes, respectively. N and F represent the nonspecific and free probe bands, respectively. The specificities of anti-CP2b and CP2c antibodies were tested by western blotting [(a), right]. Custom peptide antibody was prepared using CP2b peptide (271-LTEMRLEPIIEDAVEHEQKKSSKRTLPADYGDSLAKRGS-309). The HA-CP2b or HA-CP2c expression vector was transfected into 293T cells, and total lysates were prepared. Proteins (10 μg) were analyzed by western blotting with anti-CP2b or anti-CP2c antibody. (C) 293T cells were transiently cotransfected with pcDNA3-FLAG-PIAS1, pcDNA3-HA-CP2c and pEGFPN1-CP2b vectors. Cell lysates prepared from these cells were immunoprecipitated using IgG, anti-FLAG, anti-HA or anti-EGFP antibody, and precipitates were analyzed in western blot assays using antibodies to EGFP, FLAG or HA.
Figure 5.
Figure 5.
CP2b, CP2c and PIAS1 assemble concurrently at the α-globin promoter, and PIAS1 is essential for CP2b and CP2c to bind to the α-globin promoter. (A) ChIP-real-time qPCR analysis of the endogenous α-globin promoter in differentiating MEL cells. The relative occupancy of CP2b, CP2c and PIAS1 at the α-globin promoter in differentiating MEL cells is shown in comparison to the IgG (control) samples. Values represent the averages of three independent experiments. Mouse Nanog primers were used as a negative control for all real-time qPCR (data not shown). (B) Effects of PIAS1 knockdown on the association of CP2b and CP2c with the α-globin promoter in differentiating MEL cells. PIAS1-specific siRNA (siPIAS1) or scrambled siRNA (siControl) was transfected into MEL cells. The relative occupancy of CP2b, CP2c and PIAS1 at the α-globin promoter was compared between PIAS1-knockdown and control cells. Results represent an average of two independent experiments. The decrease in PIAS1 protein was confirmed in siPIAS1-treated cells using western blotting.
Figure 6.
Figure 6.
Determination of binding regions joining PIAS1 and CP2c/CP2b. (A) Schematic representation of the PIAS1 deletion mutants and their binding capacities for CP2c and CP2b. The amino acids corresponding to the truncated PIAS1 proteins are indicated. Binding ability of each deletion mutant for CP2b or CP2c is indicated by plus (+) and minus (−) signs. Whole cell extracts from 293T cells expressing the HA-CP2c or EGFP-CP2b protein were mixed with each of the purified GST-tagged PIAS1 deletion mutants or GST and then subjected to pull-down analysis (Supplementary Figure S2A). PL and PS indicate the large and small fragments of PIAS1, respectively. (B) Schematic representation of CP2c deletion mutants and their binding capacities for PIAS1. Total cell extracts from 293T cells expressing the large fragments of FLAG-CP2c (CL1–CL5) or FLAG-PIAS1 were incubated with GST-PIAS1 or GST-CP2c deletion mutants (CS1–CS9), as indicated. GST pull-down proteins were analyzed by immunoblotting against anti-FLAG or GST antibodies (Supplementary Figure S2B). (C) Schematic representation of CP2b deletion mutants and their binding capacities for PIAS1. Whole cell extracts from 293T cells expressing FLAG-PIAS1 were mixed with purified GST-tagged small fragments of CP2b (BS) or GST, as indicated, and binding activities were analyzed in GST pull-down assays, followed by immunoblotting with FLAG or GST antibodies (Supplementary Figure S2C).
Figure 7.
Figure 7.
PIAS1 enhances CP2c/CP2b-mediated α-globin gene expression through concerted interaction with both CP2c and CP2b. (A) Schematic representation of PIAS1 deletion mutants and summary for the results of (B), (C) and (D). (B) 293T cells were transfected with FLAG-tagged PIAS1 deletion mutants along with pEGFPN1-CP2c or pEGFPN1-CP2b expression vectors, singly or in combination, as indicated. FLAG-tagged proteins were detected with anti-FLAG antibody followed by incubation with Cy5-conjugated secondary antibody (red). Direct-immunofluorescence analysis was performed using an Olympus confocal laser scanning system. Nuclei were identified by Hoechst 33258 staining. (C) K562 cells were transiently transfected with a reporter vector containing the mouse α-globin promoter along with the indicated expression vectors. Each transfection was performed with 0.5 μg DNA. The three repetitions of each experiment were analyzed using the Student’s t-test. P-values were obtained for the comparison of bar 2 with bar 8 (P < 0.01) and bar 3 with bar 8 (P < 0.01). (D) Nuclear extracts were prepared from 293T cells expressing FLAG-PIAS1, FLAG-PIAS1-pseudo, FLAG-PIAS1 1-480, FLAG-PIAS1 400-651 or HA-CP2 isoforms. EMSA was performed, as described in Figure 4A. In (b), the indicated amounts of nuclear extracts from 293T cells expressing CP2c, CP2b, PIAS1 and/or PIAS1 mutants were added to the reaction. A plus sign (+) indicates 5 µg nuclear extract. Asterisks indicate the specific protein–DNA complex, whereas F indicates the free probe. Expression of wild-type PIAS1 and each of the PIAS1 mutant proteins was confirmed by western blot analysis using the anti-FLAG antibody (right side of (b)).
Figure 7.
Figure 7.
PIAS1 enhances CP2c/CP2b-mediated α-globin gene expression through concerted interaction with both CP2c and CP2b. (A) Schematic representation of PIAS1 deletion mutants and summary for the results of (B), (C) and (D). (B) 293T cells were transfected with FLAG-tagged PIAS1 deletion mutants along with pEGFPN1-CP2c or pEGFPN1-CP2b expression vectors, singly or in combination, as indicated. FLAG-tagged proteins were detected with anti-FLAG antibody followed by incubation with Cy5-conjugated secondary antibody (red). Direct-immunofluorescence analysis was performed using an Olympus confocal laser scanning system. Nuclei were identified by Hoechst 33258 staining. (C) K562 cells were transiently transfected with a reporter vector containing the mouse α-globin promoter along with the indicated expression vectors. Each transfection was performed with 0.5 μg DNA. The three repetitions of each experiment were analyzed using the Student’s t-test. P-values were obtained for the comparison of bar 2 with bar 8 (P < 0.01) and bar 3 with bar 8 (P < 0.01). (D) Nuclear extracts were prepared from 293T cells expressing FLAG-PIAS1, FLAG-PIAS1-pseudo, FLAG-PIAS1 1-480, FLAG-PIAS1 400-651 or HA-CP2 isoforms. EMSA was performed, as described in Figure 4A. In (b), the indicated amounts of nuclear extracts from 293T cells expressing CP2c, CP2b, PIAS1 and/or PIAS1 mutants were added to the reaction. A plus sign (+) indicates 5 µg nuclear extract. Asterisks indicate the specific protein–DNA complex, whereas F indicates the free probe. Expression of wild-type PIAS1 and each of the PIAS1 mutant proteins was confirmed by western blot analysis using the anti-FLAG antibody (right side of (b)).
Figure 8.
Figure 8.
A model of the CP2c/CP2b/PIAS1 complex activating α-globin gene expression. CP2c and CP2a localize mainly in the cytoplasm, whereas CP2b and PIAS1 co-localize in the nucleus. A specific differentiation cue may increase the amount and/or activity of CP2b and PIAS1, inducing movement of CP2c to the nucleus. Components of the hexametric CP2c/CP2b/PIAS1 complex, through a concerted interaction, strongly enhance binding to the α-globin gene promoter and α-globin transcription in erythroid cells.

Similar articles

Cited by

References

    1. Veljkovic J, Hansen U. Lineage-specific and ubiquitous biological roles of the mammalian transcription factor LSF. Gene. 2004;343:23–40. - PMC - PubMed
    1. Jane SM, Ney PA, Vanin EF, Gumucio DL, Nienhuis AW. Identification of a stage selector element in the human gamma-globin gene promoter that fosters preferential interaction with the 5′ HS2 enhancer when in competition with the beta-promoter. EMBO J. 1992;11:2961–2969. - PMC - PubMed
    1. Zhou W, Clouston DR, Wang X, Cerruti L, Cunningham JM, Jane SM. Induction of human fetal globin gene expression by a novel erythroid factor, NF-E4. Mol. Cell. Biol. 2000;20:7662–7672. - PMC - PubMed
    1. Zhou W, Zhao Q, Sutton R, Cumming H, Wang X, Cerruti L, Hall M, Wu R, Cunningham JM, Jane SM. The role of p22 NF-E4 in human globin gene switching. J. Biol. Chem. 2004;279:26227–26232. - PubMed
    1. Bosè F, Fugazza C, Casalgrandi M, Capelli A, Cunningham JM, Zhao Q, Jane SM, Ottolenghi S, Ronchi A. Functional interaction of CP2 with GATA-1 in the regulation of erythroid promoters. Mol. Cell. Biol. 2006;26:3942–3954. - PMC - PubMed

Publication types

MeSH terms