. 2010 Sep;38(16):5336-50.
doi: 10.1093/nar/gkq268. Epub 2010 Apr 26.

An extended set of PRDM1/BLIMP1 target genes links binding motif type to dynamic repression

Affiliations

An extended set of PRDM1/BLIMP1 target genes links binding motif type to dynamic repression

Gina M Doody et al. Nucleic Acids Res. 2010 Sep.

Abstract

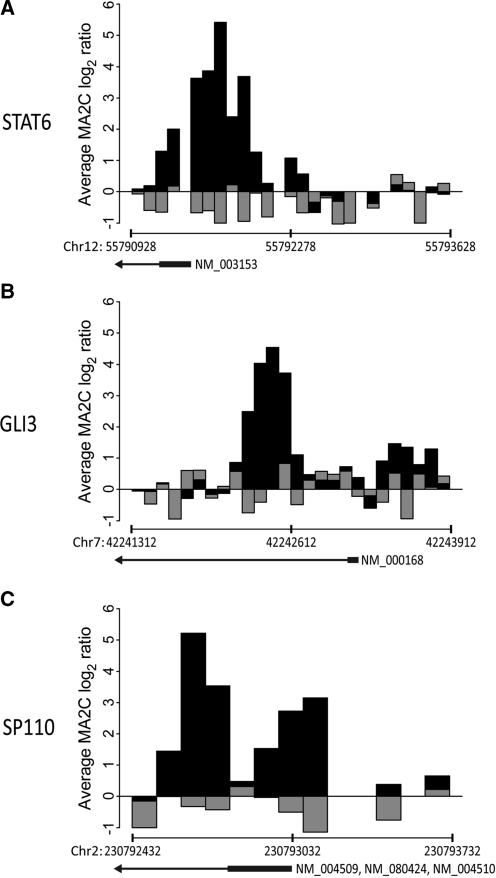
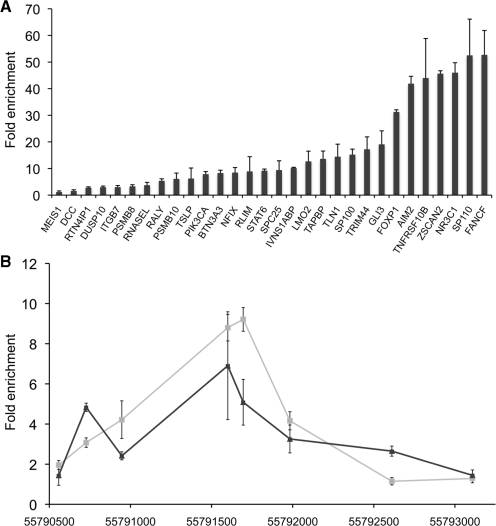
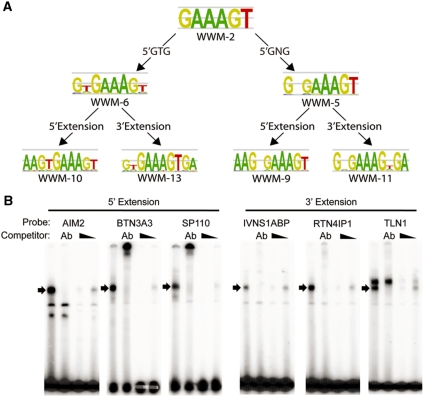
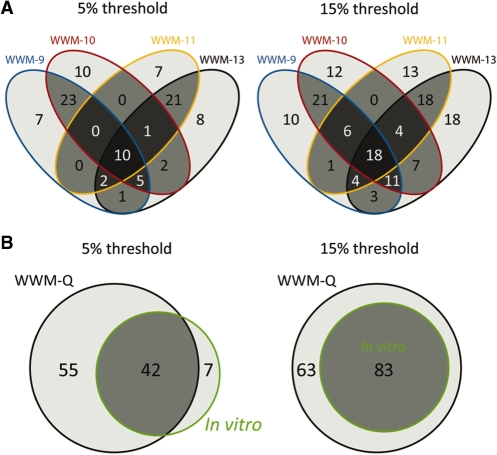
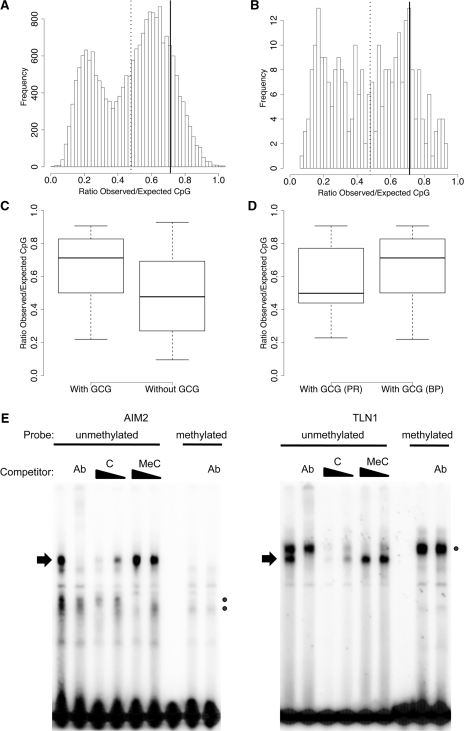
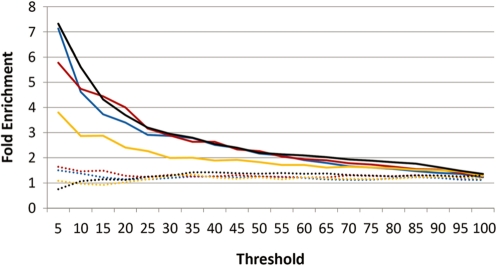
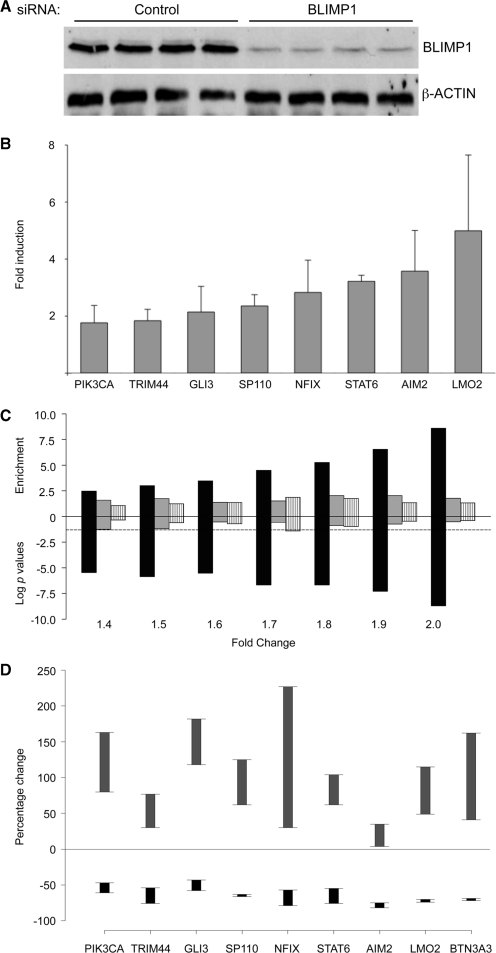
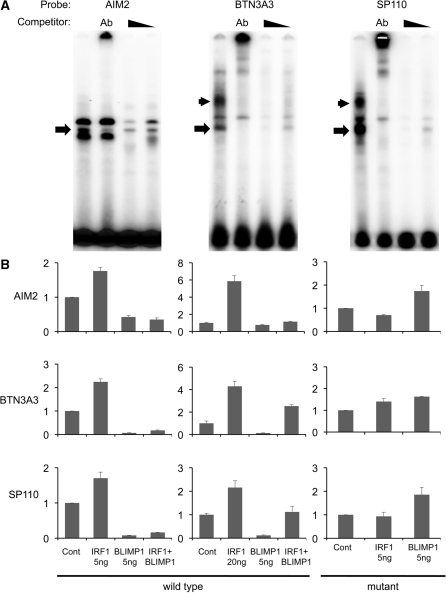
The transcriptional repressor B lymphocyte-induced maturation protein-1 (BLIMP1) regulates gene expression and cell fate. The DNA motif bound by BLIMP1 in vitro overlaps with that of interferon regulatory factors (IRFs), which respond to inflammatory/immune signals. At such sites, BLIMP1 and IRFs can antagonistically regulate promoter activity. In vitro motif selection predicts that only a subset of BLIMP1 or IRF sites is subject to antagonistic regulation, but the extent to which antagonism occurs is unknown, since an unbiased assessment of BLIMP1 occupancy in vivo is lacking. To address this, we identified an extended set of promoters occupied by BLIMP1. Motif discovery and enrichment analysis demonstrate that multiple motif variants are required to capture BLIMP1 binding specificity. These are differentially associated with CpG content, leading to the observation that BLIMP1 DNA-binding is methylation sensitive. In occupied promoters, only a subset of BLIMP1 motifs overlap with IRF motifs. Conversely, a distinct subset of IRF motifs is not enriched amongst occupied promoters. Genes linked to occupied promoters containing overlapping BLIMP1/IRF motifs (e.g. AIM2, SP110, BTN3A3) are shown to constitute a dynamic target set which is preferentially activated by BLIMP1 knock-down. These data confirm and extend the competitive model of BLIMP1 and IRF interaction.


Figures

Figure 1.
Figure 1.
ChIP-chip identifies BLIMP1 promoter occupancy. Representative primary ChIP-chip data from genomic regions including the promoters for STAT6 (A), GLI3 (B) and SP110 (C). Each panel shows the average of U266 (black bars) and Daudi (grey bars) data sets. The y-axis shows the log2 ratio of signal derived from hybridization of specific BLIMP1 against control rabbit Ig ChIP samples. The x-axis shows the genomic coordinates of micro-array tiles. The position of the TSS for each gene is displayed.
Figure 2.
Figure 2.
Validation of BLIMP1 occupied promoters. (A) Real-time PCR quantification of BLIMP1 promoter occupancy in triplicate ChIP samples from U266 cells. Data are displayed as mean fold enrichment±SD relative to control rabbit IgG. Twenty-seven new peak regions as well as three known targets (PSMB8, PSMB10 and TAPBP) are shown. The known target PSMB8, was used as threshold (3.2±0.6) to confirm interaction. (B) Quantification of BLIMP1 binding across the identified peak region spanning the STAT6 promoter by real-time PCR. The x-axis shows co-ordinates on human chromosome 12 (hg18). Grey lines represent the mean fold enrichment±SD from three ChIP samples relative to control IgG from U266 myeloma cells. Black lines show the equivalent data from an additional myeloma cell line H929 myeloma. The background enrichment at unoccupied promoter regions is below 2-fold.
Figure 3.
Figure 3.
De novo motif detection of the in vivo BLIMP1 binding consensus. (A) Sequence logos for 7 out of 14 matrices derived by the Weeder program from occupied promoter regions are shown. These represent two themes around a common core element: a more ‘GTG’ or less ‘GNG’ restrictive 5′ triplet, and either additional 5′ or 3′ extensions. (B) EMSA was performed with nuclear extracts from BLIMP1 transfected COS cells and oligonucleotides corresponding to a range of 5′ (AIM2, BTN3A3 and SP110) or 3′ extension sites (IVNS1ABP, RTN4IP1, TLN1). BLIMP1 complexes (arrow) were identified by antibody supershift (Ab), and specificity of interaction was confirmed by competition with 100- or 10-fold excess of unlabelled probe (wedge).
Figure 4.
Figure 4.
Related matrices provide non-redundant information. (A) Venn diagrams display the intersection between the sets of genes linked to promoters with significant matches to the quartet of matrices WWM-9, WWM-10, WWM-11 and WWM-13, which represent the extremes of motif variants. Results are shown at two thresholds: top 5% of matrix matches (left) and top 15% of matrix matches (right). (B) Displayed are the overlap between the in vitro matrix for BLIMP1 and the combined results of WWM-quartet (WWM-Q). Results are displayed for two thresholds: top 5% of matrix matches (left) and top 15% of matrix matches (right).
Figure 5.
Figure 5.
Motif type, CpGs and methylation sensitive DNA binding. (A) Graph of CpG content of all tiled promoter regions, and (B) graph of the distribution of CpG content in all BLIMP1 occupied promoters. Median CpG ratio of occupied promoter regions containing a top 15% WWM-Q match with GCG triplet (solid line) or a top 15% WWM-Q match without GCG triplet (dashed line). y-Axes, number of promoter regions; x-axes, ratio of observed to expected CpG content [number of CpG/(Number of C×Number of G)×sequence length], bin size = 0.02. (C) Box-plot of CpG content in bound peak regions containing a top 15% BLIMP1 motif match with GCG triplet (left) and a top 15% BLIMP1 motif match without GCG triplet (right), and (D) box-plot comparing tiled promoter (PR) regions to bound peak (BP) regions for occupied promoters with a top 15% BLIMP1 motif match containing a GCG triplet. y-Axes, ratio of observed to expected CpG content described above. (E) EMSA was performed with nuclear extracts from BLIMP1 transfected COS cells and oligonucleotide probes corresponding to AIM2 (left panel) or TLN1 (right panel) sites, respectively. Within each panel, the left six lanes show EMSAs with a labelled unmethylated probe, whereas the right two lanes show EMSAs done with probes containing symmetrically methylated CpGs. The expected BLIMP1 complexes (arrows) were observed with the labelled unmethylated probe and confirmed by antibody supershift (competitor: Ab) but did not form with methylated probes. To confirm loss of BLIMP1 binding to methylated probes, cold competition was performed with a 100- or 10-fold excess of unmethylated unlabelled competitor (competitor: C) or methylated unlabelled competitor (competitor: MeC). Circles indicate other protein–DNA complexes distinct form BLIMP1 whose binding was not abolished by DNA methylation.
Figure 6.
Figure 6.
In silico ‘mutagenesis’ identifies potential IRF motifs not subject to antagonistic regulation. The graph displays the fold enrichment (y-axis) of the WWM-Q (solid lines) and ‘mutated’ variants (broken lines) across 20 motif thresholds (x-axis) compared to 106 matched random promoter regions. Values for original WWM-Qs are as in Table 1: WWM-9 (blue lines), WWM-10 (red lines), WWM-11 (yellow lines) and WWM-13 (black lines).
Figure 7.
Figure 7.
Occupancy and motif type define a distinct subset of dynamically regulated BLIMP1 targets. (A) siRNA knockdown of BLIMP1 in U266 myeloma cells. Quadruplicate samples of U266 cells were transfected with control siRNA or siRNA directed against BLIMP1. The protein levels of BLIMP1 and β-ACTIN present in cell lysates were determined 24 h post-transfection. (B) Alteration of BLIMP1 target gene expression in siRNA-treated U266 cells. Changes in expression of individual target genes were evaluated by quantitative RT-PCR. Shown are representative target genes with expression normalized to GAPDH and displayed as fold-change (y-axis) in expression relative to control siRNA-treated samples. (C) Global gene expression changes in siRNA-treated samples were evaluated on NimbleGen micro-arrays. BLIMP1 target genes were divided into three groups according to motif type: (i) those whose promoters contain a top 15% WWM-Q match with IRF overlap (black fill), (ii) those whose promoters contain a top 15% WWM-Q match without IRF overlap (grey fill) (iii) all other occupied promoters (vertical stripes). The enrichment of these target genes amongst all genes showing an increase in expression above fold-change cut-offs from 1.4- to 2-fold was evaluated using a hypergeometric test. The observed enrichment for each group amongst genes changing expression is shown in the upward bars, the significance of this enrichment is shown as the log10 of the P-value in downward bars. The dotted line represents P ≤ 0.05. (D) Dynamically regulated promoters show a shift in occupancy from BLIMP1 to IRFs following BLIMP1 knockdown. U266 cells were transfected with control siRNA or siRNA directed against BLIMP1. ChIP was performed with control antibody and antibodies specific to BLIMP1 or a mixture of antibodies recognizing IRF1 and IRF2. Enrichment of promoter fragments was determined for control and BLIMP1 siRNA transfected cells. The percentage change (y-axis) in enrichment for each promoter (BLIMP1-siRNA ChIP/Control siRNA ChIP) is displayed. Bars show the range of values observed for duplicate ChIP samples (IRF: grey bars, BLIMP1: black bars). Results are representative of three independent experiments.
Figure 8.
Figure 8.
Overlapping BLIMP1/IRF binding sites bind IRF1 and mediate IRF1 and BLIMP1-dependent gene regulation. (A) EMSA was performed with nuclear extracts from IRF1 transfected COS cells and oligonucleotides containing an overlapping BLIMP1/IRF site (AIM2, BTN3A3 and SP110). IRF1 complexes were identified by antibody supershift (Ab), and specificity of interaction was confirmed by competition with 100- or 10-fold excess of unlabelled probe (wedge). IRF1 bound as a single molecule is indicated by a long arrow, whereas co-occupancy of the site by two molecules of IRF1 is indicated by short arrows. (B) HeLa cells were co-transfected with vectors carrying luciferase reporter constructs driven by wild-type promoters of the indicated genes or promoters where IRF/BLIMP1 overlap sites were mutated, together with empty vector (cont), two different amounts of IRF1 (5 ng or 20 ng), and/or BLIMP1 (5 ng) expression vectors. Luciferase activity was assayed 24 h post-transfection. Luciferase activity (y-axis) is displayed normalized to renilla and relative to the control transfected sample. Data are derived from triplicate samples and are displayed as the mean ±SD.

Similar articles

Cited by

References

    1. Bikoff EK, Morgan MA, Robertson EJ. An expanding job description for Blimp-1/PRDM1. Curr. Opin. Genet. Dev. 2009;19:379–385. - PubMed
    1. Shapiro-Shelef M, Lin KI, McHeyzer-Williams LJ, Liao J, McHeyzer-Williams MG, Calame K. Blimp-1 is required for the formation of immunoglobulin secreting plasma cells and pre-plasma memory B cells. Immunity. 2003;19:607–620. - PubMed
    1. Shaffer AL, Lin KI, Kuo TC, Yu X, Hurt EM, Rosenwald A, Giltnane JM, Yang L, Zhao H, Calame K, et al. Blimp-1 orchestrates plasma cell differentiation by extinguishing the mature B cell gene expression program. Immunity. 2002;17:51–62. - PubMed
    1. Kallies A, Hasbold J, Tarlinton DM, Dietrich W, Corcoran LM, Hodgkin PD, Nutt SL. Plasma cell ontogeny defined by quantitative changes in blimp-1 expression. J. Exp. Med. 2004;200:967–977. - PMC - PubMed
    1. Kallies A, Hawkins ED, Belz GT, Metcalf D, Hommel M, Corcoran LM, Hodgkin PD, Nutt SL. Transcriptional repressor Blimp-1 is essential for T cell homeostasis and self-tolerance. Nat. Immunol. 2006;7:466–474. - PubMed

Publication types

Substances