. 2010 Jul 2;285(27):21134-42.
doi: 10.1074/jbc.M110.137828. Epub 2010 Apr 26.

Comprehensive mapping of the human kinome to epidermal growth factor receptor signaling

Affiliations

Comprehensive mapping of the human kinome to epidermal growth factor receptor signaling

Kakajan Komurov et al. J Biol Chem. .

Abstract

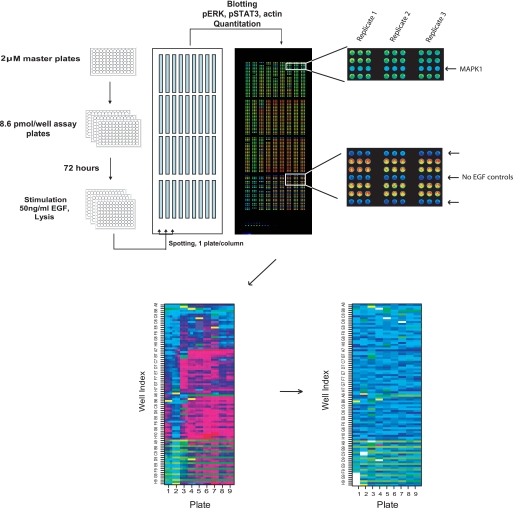
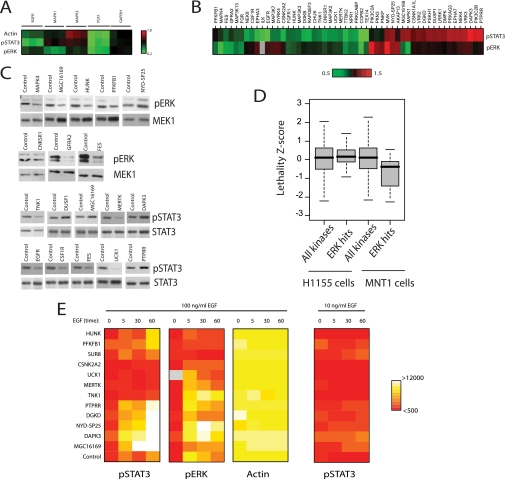
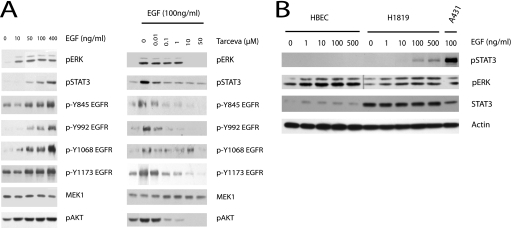
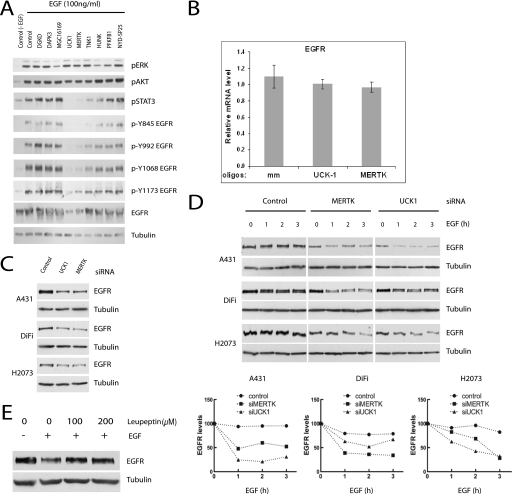
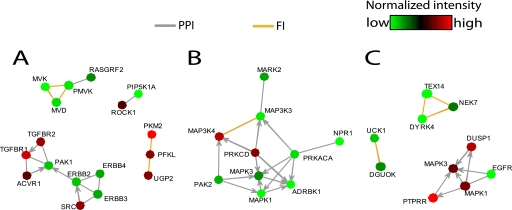
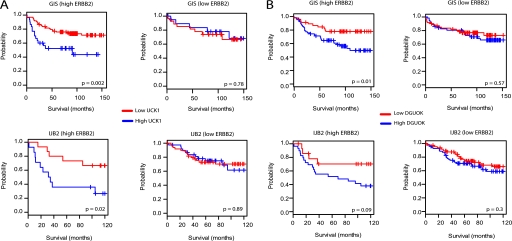
Disregulation of epidermal growth factor receptor (EGFR) signaling directly promotes bypass of proliferation and survival restraints in a high frequency of epithelia-derived cancer. As such, much effort is currently focused on decoding the molecular architecture supporting EGFR activation and function. Here, we have leveraged high throughput reverse phase protein lysate arrays, with a sensitive fluorescent nanocrystal-based phosphoprotein detection assay, together with large scale siRNA-mediated loss of function to execute a quantitative interrogation of all elements of the human kinome supporting EGF-dependent signaling. This screening platform has captured multiple novel contributions of diverse protein kinases to modulation of EGFR signal generation, signal amplitude, and signal duration. As examples, the prometastatic SNF1/AMPK-related kinase hormonally upregulated Neu kinase was found to support EGFR activation in response to ligand binding, whereas the enigmatic kinase MGC16169 selectively supports coupling of active EGFR to ERK1/2 regulation. Of note, the receptor tyrosine kinase MERTK and the pyrimidine kinase UCK1 were both found to be required for surface accumulation of EGFR and subsequent pathway activation in multiple cancer cell backgrounds and may represent new targets for therapeutic intervention.


Figures

FIGURE 1.
FIGURE 1.
Kinome screening protocol. For each kinome siRNA library master plate (2 μm siRNA concentration in each well), three assay plates with 8.6 pmol of siRNA per well was generated. Transfections were performed in triplicate for biological replicates. After 72 h of transfection, cells were stimulated with 50 ng/ml EGF for 5 min. Lysates were printed onto nitrocellulose slides at a density of 9 plates per slide. Each well was spotted in triplicate for technical reproducibility. Slides were incubated with antibodies against pERK, pSTAT3, and actin. A representative false color image of a slide immunostained with pERK is shown. Each plate has −EGF and +EGF control wells as indicated in the enlarged panel at bottom left. Qualitative consequences of pERK signal intensity upon MAPK1 depletion are evident in the enlarged panel at the top left panel. Due to position-specific artifacts in slide processing, there is a significant position-specific variation in the spot intensity values across the slide (bottom left panel). Nearest neighbor normalization resulted in a consistent distribution of spot intensities across the slides (bottom right panel).
FIGURE 2.
FIGURE 2.
Candidate modulators of EGF-induced ERK1/2 and STAT3 activation. A, the heat map of normalized mean intensity values for siRNAs targeting EGFR, MAPK1, MAPK3, PLK1, and glyceraldehyde-3-phosphate dehydrogenase (GAPDH) is shown. B, the 52 gene hit list. Those siRNA pools with reproducible consequences on ERK1/2 and/or STAT3 activation are shown. The heat map color scale indicates normalized intensity values for respective antibodies. The gene targets were clustered according to their normalized intensity values (unsupervised hierarchical cluster). C, immunoblot validation of a representative panel of hits. Whole-cell lysates prepared from independent transfections were separated by SDS-PAGE and immunoblotted as indicated. Nontargeting siRNAs were used as controls. D, box plots of MNT1 and H1155 cell lethality z-score values for pERK hits relative to other kinases in the screen. E, Heat maps of RPPA analysis of the time courses of EGF stimulation in response to knockdown of the indicated genes. After a 72-h transfection with respective siRNA oligonucleotides, cells were stimulated with 10 (right panel) or 100 ng/ml EGF and collected after 5, 30, or 60 min. The heat map color scale indicates raw intensity values for respective antibodies. SUR8 is included as a positive control of ERK signal abrogation in response to EGF. The right panel shows pSTAT3 stimulation in response to low EGF concentration.
FIGURE 3.
FIGURE 3.
ERK and STAT3 pathways are differentially sensitive to EGF receptor activity. A, cells were stimulated with increasing concentrations of EGF for 5 min (left panel) or treated with increasing concentrations of Tarceva (erlotinib) before stimulating with 100 ng/ml EGF for 5 min (right panel). Lysates were immunoblotted with indicated antibodies. MEK1 is included as a control for equal protein loading. B, human bronchial epithelial cell line (HBEC) and H1819 (lung adenocarcinoma cell line) cells were stimulated for 5 min with increasing concentrations of EGF and probed for pERK and pSTAT3. An A431 lysate of equivalent total protein concentration from 100 ng/ml EGF stimulation is included for comparison.
FIGURE 4.
FIGURE 4.
UCK1 and MERTK regulate STAT3 signaling by modulating EGFR stability in response to EGF. A, A431 cells transfected with the indicated siRNAs were immunoblotted with the indicated antibodies. Whole-cell lysates from a 5-min incubation in 100 ng/ml EGF were prepared 72 h post-transfection. B, relative mRNA levels of EGFR in response to UCK1 and MERTK knockdown. C, the indicated cell lines were transfected with siRNAs targeting UCK1 or MERTK. 48 h post-transfection, lysates were immunoblotted to detect steady-state EGFR concentrations. D, cells treated as in B were stimulated with EGF 48 h post-transfection for the specified times followed by immunobotting for total EGFR protein accumulation. Immunoblots (top panels) and quantitation of band intensities (bottom panels) are shown from a representative experiment from three repeats. E, A431 cells transfected with siRNAs targeting UCK1 were treated with leupeptin or not 48 h post-transfection, as indicated, followed by a 3-h incubation in 100 ng/ml EGF. Whole-cell lysates were immunoblotted for detection of EGFR protein accumulation.
FIGURE 5.
FIGURE 5.
Representative interactions in the highest scoring networks for actin, ERK, and STAT3 data sets. A, subnetwork showing representative highest scoring interactions in the actin network (see supplemental Fig. 3 for the full network). B, representative interactions that are unique for ERK network (see supplemental Fig. 4 for full ERK network). C, representative interactions unique to the STAT3 network (see supplemental Fig. 5 for the full highest scoring network). Colors of nodes indicate their normalized signal intensity values according to respective color keys in each panel. Edge colors indicate type of interaction as shown (PPI, protein-protein interaction; FI, functional interaction as described under “Experimental Procedures”). Network plots were generated by a custom code based on the g plot function in the sna package for R. PRKACA, protein kinase A; ADRBK1, β-adrenergic receptor kinase; DGUOK, deoxyguanosine kinase.
FIGURE 6.
FIGURE 6.
Clinical significance of UCK1 and DGUOK expression in ERBB2-expressing breast cancer patients. Kaplan-Meier survival curves for breast cancer patients with high and low ERBB2 expression with respect to UCK1 (A) and DGUOK (B) expression. In the upper panels in A and B, Genome Institute of Singapore patient cohort data (38) were used. For lower panels, Jules Bordet Institute data (39) was used. High and low ERBB2 patients were determined from supplied ERBB2 measurement levels in the IJB clinical data. For the GIS data set, these were determined based on ERBB2 mRNA levels in the microarray dataset. p values were calculated using log-rank test in “survival” package for R. DGUOK, deoxyguanosine kinase.

References

    1. Johnson S. A., Hunter T. (2005) Nat. Methods 2, 17–25 - PubMed
    1. Dhanasekaran D. N., Johnson G. L. (2007) Oncogene 26, 3097–3099 - PubMed
    1. Raman M., Cobb M. H. (2003) Curr. Biol. 13, R886–888 - PubMed
    1. Liotta L. A., Espina V., Mehta A. I., Calvert V., Rosenblatt K., Geho D., Munson P. J., Young L., Wulfkuhle J., Petricoin E. F., 3rd. (2003) Cancer Cell 3, 317–325 - PubMed
    1. Elbashir S. M., Harborth J., Lendeckel W., Yalcin A., Weber K., Tuschl T. (2001) Nature 411, 494–498 - PubMed

Publication types

LinkOut - more resources