

Noncanonical transcript forms in yeast and their regulation during environmental stress
- PMID: 20421314
- PMCID: PMC2874177
- DOI: 10.1261/rna.2038810
Noncanonical transcript forms in yeast and their regulation during environmental stress
Abstract
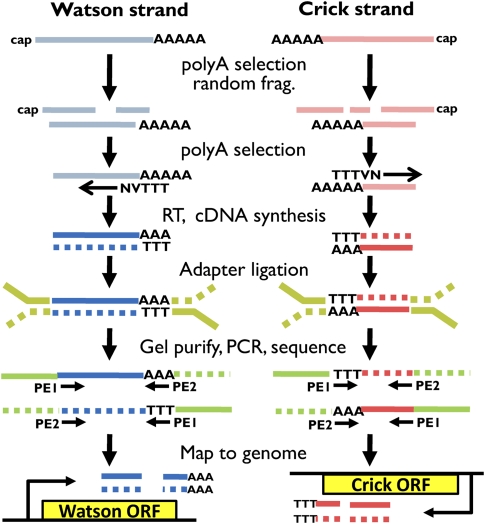
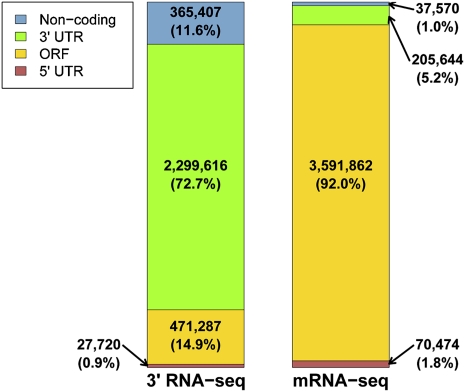
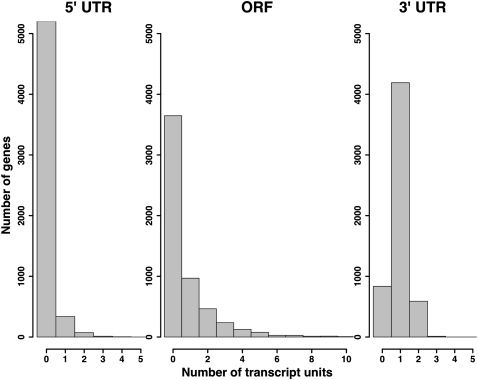
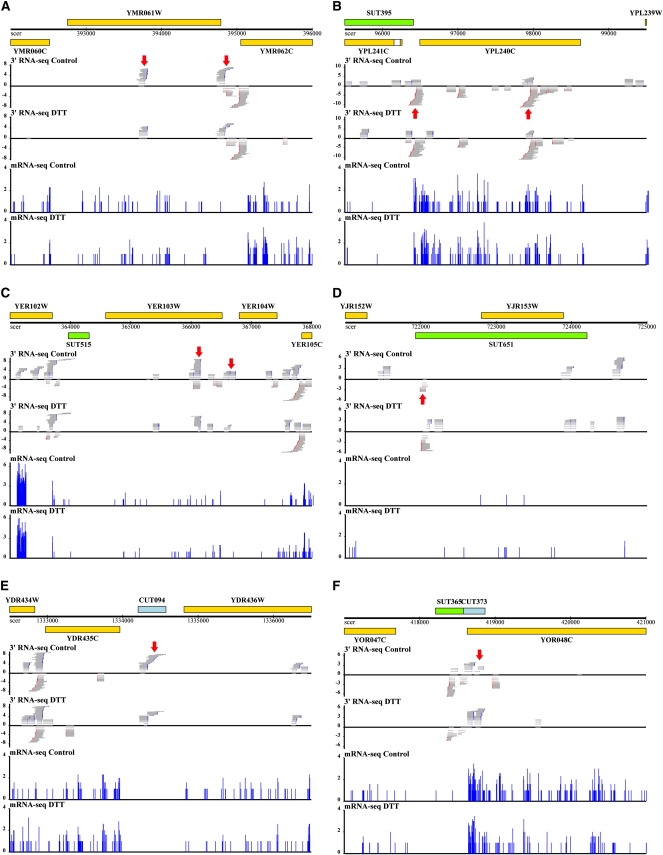
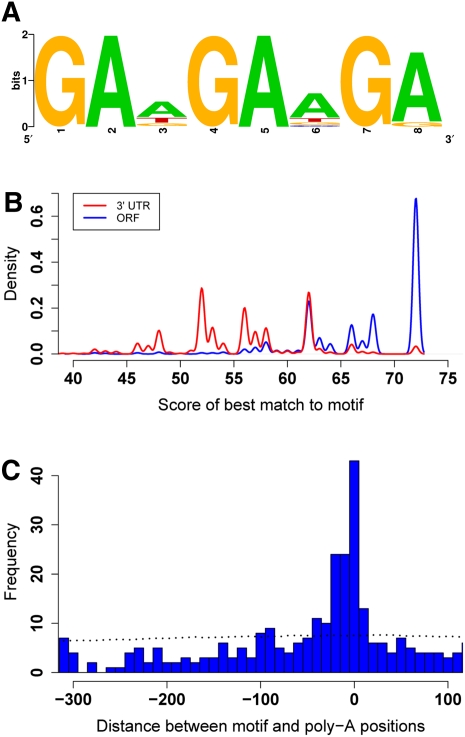
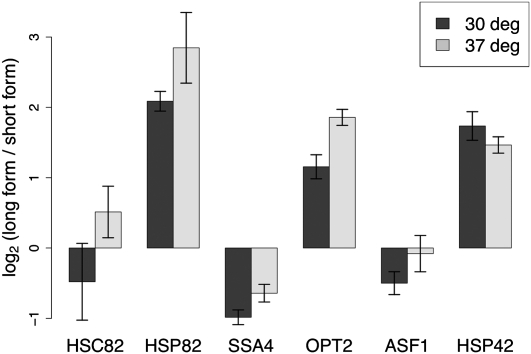
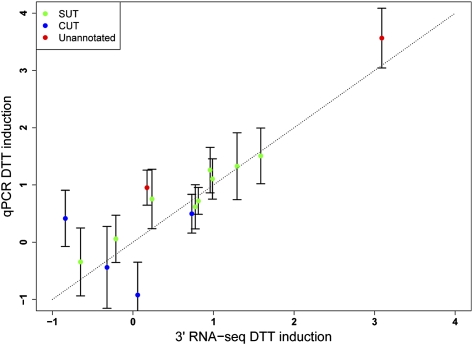
Surveys of transcription in many organisms have observed widespread expression of RNAs with no known function, encoded within and between canonical coding genes. The search to distinguish functional RNAs from transcriptional noise represents one of the great challenges in genomic biology. Here we report a next-generation sequencing technique designed to facilitate the inference of function of uncharacterized transcript forms by improving their coverage in sequencing libraries, in parallel with the detection of canonical mRNAs. We piloted this protocol, which is based on the capture of 3' ends of polyadenylated RNAs, in budding yeast. Analysis of transcript ends in coding regions uncovered hundreds of alternative-length coding forms, which harbored a unique sequence motif and showed signatures of regulatory function in particular gene categories; independent single-gene measurements confirmed the differential regulation of short coding forms during heat shock. In addition, our 3'-end RNA-seq method applied to wild-type strains detected putative noncoding transcripts previously reported only in RNA surveillance mutants, and many such transcripts showed differential expression in yeast cultures grown under chemical stress. Our results underscore the power of the 3'-end protocol to improve detection of noncanonical transcript forms in a sequencing experiment of standard depth, and our findings strongly suggest that many unannotated, polyadenylated RNAs may have as yet uncharacterized regulatory functions.
Figures
Similar articles
-
Bidirectional promoters generate pervasive transcription in yeast.Nature. 2009 Feb 19;457(7232):1033-7. doi: 10.1038/nature07728. Epub 2009 Jan 25. Nature. 2009. PMID: 19169243 Free PMC article.
-
Extensive transcriptional heterogeneity revealed by isoform profiling.Nature. 2013 May 2;497(7447):127-31. doi: 10.1038/nature12121. Epub 2013 Apr 24. Nature. 2013. PMID: 23615609 Free PMC article.
-
Dynamic repertoire of a eukaryotic transcriptome surveyed at single-nucleotide resolution.Nature. 2008 Jun 26;453(7199):1239-43. doi: 10.1038/nature07002. Epub 2008 May 18. Nature. 2008. PMID: 18488015
-
Non-coding transcription by RNA polymerase II in yeast: Hasard or nécessité?Biochimie. 2015 Oct;117:28-36. doi: 10.1016/j.biochi.2015.04.020. Epub 2015 May 6. Biochimie. 2015. PMID: 25956976 Review.
-
Understanding non-coding DNA regions in yeast.Biochem Soc Trans. 2013 Dec;41(6):1654-9. doi: 10.1042/BST20130144. Biochem Soc Trans. 2013. PMID: 24256270 Review.
Cited by
-
Mapping 3' mRNA isoforms on a genomic scale.Curr Protoc Mol Biol. 2015 Apr 1;110:4.23.1-4.23.17. doi: 10.1002/0471142727.mb0423s110. Curr Protoc Mol Biol. 2015. PMID: 25827089 Free PMC article.
-
Testing the Genomic Shock Hypothesis Using Transposable Element Expression in Yeast Hybrids.Front Fungal Biol. 2021 Aug 23;2:729264. doi: 10.3389/ffunb.2021.729264. eCollection 2021. Front Fungal Biol. 2021. PMID: 37744137 Free PMC article.
-
A Genetic Tool to Track Protein Aggregates and Control Prion Inheritance.Cell. 2017 Nov 2;171(4):966-979.e18. doi: 10.1016/j.cell.2017.09.041. Epub 2017 Oct 19. Cell. 2017. PMID: 29056345 Free PMC article.
-
Cellular stress alters 3'UTR landscape through alternative polyadenylation and isoform-specific degradation.Nat Commun. 2018 Jun 11;9(1):2268. doi: 10.1038/s41467-018-04730-7. Nat Commun. 2018. PMID: 29891946 Free PMC article.
-
Yeast pheromone receptor genes STE2 and STE3 are differently regulated at the transcription and polyadenylation level.Proc Natl Acad Sci U S A. 2011 Oct 11;108(41):17082-6. doi: 10.1073/pnas.1114648108. Epub 2011 Oct 3. Proc Natl Acad Sci U S A. 2011. PMID: 21969566 Free PMC article.
References
-
- Arigo JT, Carroll KL, Ames JM, Corden JL 2006. Regulation of yeast NRD1 expression by premature transcription termination. Mol Cell 21: 641–651 - PubMed
-
- Ausubel FM, Brent B, Kingston RE, Moore DD 1995. Current protocols in molecular biology Wiley, New York
-
- Bailey TL, Elkan C 1994. Fitting a mixture model by expectation maximization to discover motifs in biopolymers. Proc Int Conf Intell Syst Mol Biol 2: 28–36 - PubMed
Publication types
MeSH terms
Substances
Grants and funding
LinkOut - more resources
Full Text Sources
Other Literature Sources
Molecular Biology Databases