. 2010 Jun 7;207(6):1173-82.
doi: 10.1084/jem.20091318. Epub 2010 Apr 26.

Heterogeneity and hierarchy within the most primitive hematopoietic stem cell compartment

Affiliations

Heterogeneity and hierarchy within the most primitive hematopoietic stem cell compartment

Yohei Morita et al. J Exp Med. .

Abstract

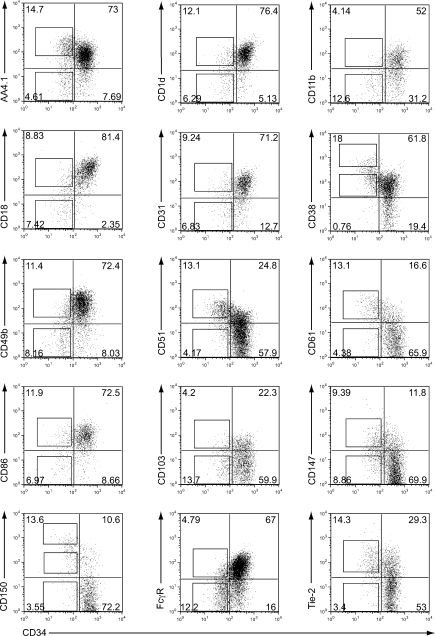
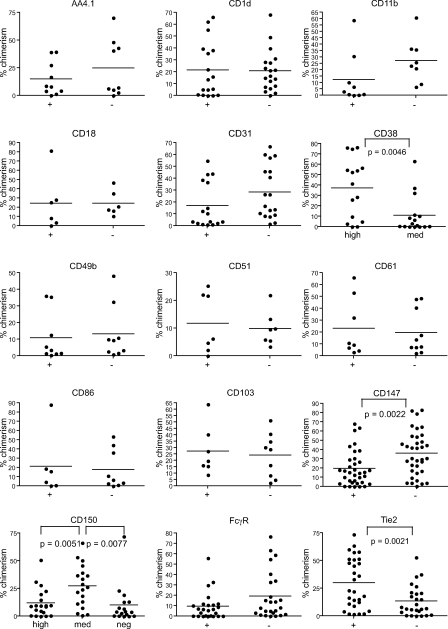
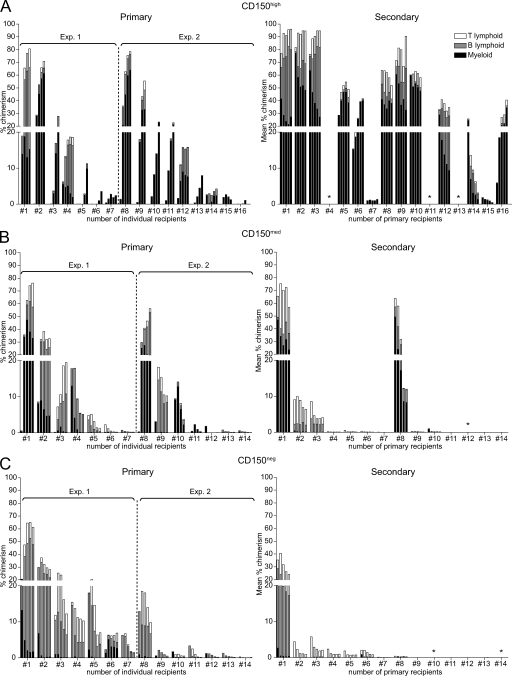
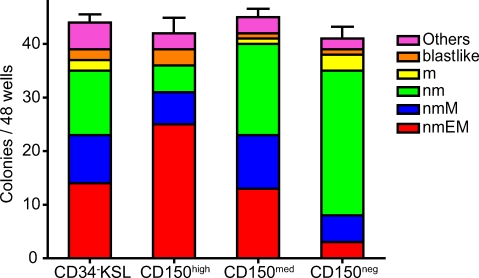
Hematopoietic stem cells (HSCs) have been extensively characterized based on functional definitions determined by experimental transplantation into lethally irradiated mice. In mice, HSCs are heterogeneous with regard to self-renewal potential, in vitro colony-forming activity, and in vivo behavior. We attempted prospective isolation of HSC subsets with distinct properties among CD34(-/low) c-Kit+Sca-1+Lin- (CD34-KSL) cells. CD34-KSL cells were divided, based on CD150 expression, into three fractions: CD150high, CD150med, and CD150neg cells. Compared with the other two fractions, CD150high cells were significantly enriched in HSCs, with great self-renewal potential. In vitro colony assays revealed that decreased expression of CD150 was associated with reduced erythroblast/megakaryocyte differentiation potential. All three fractions were regenerated only from CD150high cells in recipient mice. Using single-cell transplantation studies, we found that a fraction of CD150high cells displayed latent and barely detectable myeloid engraftment in primary-recipient mice but progressive and multilineage reconstitution in secondary-recipient mice. These findings highlight the complexity and hierarchy of reconstitution capability, even among HSCs in the most primitive compartment.


Figures

Figure 1.
Figure 1.
Markers with heterogeneous expression in CD34KSL cells. KSL cells were stained with FITC-conjugated anti-CD34 antibody and additional PE-conjugated antibodies as shown. Shown are flow cytometric profiles for the markers that had heterogeneous expression within CD34KSL cells (percentages are shown). Marker-positive or -negative cells were separated by using the sorting gates (shown as squares). In the case of CD150, CD34KSL cells were separated into CD150high, CD150med, and CD150neg fractions. In the case of CD38, CD34KSL cells were separated into CD38high and CD38med fractions. The data represent four to eight independent experiments.
Figure 2.
Figure 2.
Long-term reconstitution by fractions of CD34KSL cells. CD34KSL cells were subdivided into fractions positive and negative for additional markers. 10 cells from each fraction were transplanted into each member of a group of lethally irradiated mice along with 2 × 10⁵ competitor cells. Recipient mice were analyzed 4–5 mo after transplantation. Chimerism levels for all individuals in each group of mice are shown. Horizontal lines represent means.
Figure 3.
Figure 3.
Reconstitution kinetics with CD150high, CD150med, and CD150neg CD34KSL cells. Each of a group of lethally irradiated mice received 10 CD150high cells, 10 CD150med cells, or 10 CD150negCD34KSL cells. (left) The change in the percentage of chimerism over time. Blood of recipient mice was analyzed 2, 3, 4, and 5 mo after transplantation. Each line shows a change in the percentage of chimerism from one recipient mouse. (right) The relative myeloid, B lymphoid, and T lymphoid lineage contributions in reconstituted donor-derived blood cells of individual recipient mice 4 mo after transplantation. Myeloid lineage represents 53.7 ± 27.2% (n = 19), 22 ± 21.8% (n = 19), and 13 ± 21.7% (n = 14; mean ± SD) after transplantation with CD150high, CD150med, and CD150negCD34KSL cells, respectively. B lymphoid lineage represents 38.2 ± 21.5% (n = 19), 56.2 ± 17.9% (n = 19), and 60.7 ± 21.5% (n = 14; mean ± SD) after transplantation with CD150high, CD150med, and CD150negCD34KSL cells, respectively. T lymphoid lineage represents 8 ± 8.4% (n = 19), 21.8 ± 9.4% (n = 19), and 26.3 ± 19.4% (n = 14; mean ± SD) after transplantation with CD150high, CD150med, and CD150negCD34KSL cells, respectively. The proportion of myeloid lineage reconstitution by CD150highCD34KSL cells was significantly greater than that of CD150negCD34KSL cells (P < 0.0001).
Figure 4.
Figure 4.
Single-cell transplantation. (A–C) Single CD150highCD34KSL (A), CD150medCD34KSL (B), and CD150negCD34KSL cells (C) were transplanted into 40 lethally irradiated mice together with 2 × 10⁵ competitor cells. Blood of recipient mice was periodically analyzed 1, 2, 3, 4, and 5 mo after transplantation. Secondary transplantation was performed using 5 × 10⁶ reconstituted bone marrow cells of recipient mice. Blood of secondary-recipient mice was periodically analyzed 1, 2, 3, 4, and 5 mo after transplantation. Data from secondary transplantation show the mean percentage of chimerism (n = 3–5). The five sequential bars for each recipient mouse indicate the percentage of chimerism 1, 2, 3, 4, and 5 mo after transplantation. *, mice that died before secondary transplantation.
Figure 5.
Figure 5.
Colony formation by single cells. Single-cell cultures were performed using CD34KSL, CD150highCD34KSL, CD150medCD34KSL, and CD150negCD34KSL cells. 48 CD34KSL, CD150highCD34KSL, CD150medCD34KSL, and CD150negCD34KSL cells formed 44 ± 3, 42 ± 5, 45 ± 3, and 41 ± 4 colonies, respectively (n = 3; mean ± SD). E, erythroblast; m, macrophage; M, megakaryocyte; n, neutrophil.
Figure 6.
Figure 6.
Regeneration of CD150highCD34KSL cells after transplantation. (A) Three recipient mice reconstituted with 10 CD150high or CD150medCD34KSL cells were analyzed 8 mo after transplantation. CD34 and CD150 expression by KSL bone marrow cells derived from CD150highCD34KSL or CD150medCD34KSL cells is shown (percentages are shown). (B) Reconstitution kinetics of recipient mice described in A.

References

    1. Abkowitz J.L., Golinelli D., Harrison D.E., Guttorp P. 2000. In vivo kinetics of murine hemopoietic stem cells. Blood. 96:3399–3405 - PubMed
    1. Adolfsson J., Borge O.J., Bryder D., Theilgaard-Mönch K., Astrand-Grundström I., Sitnicka E., Sasaki Y., Jacobsen S.E. 2001. Upregulation of Flt3 expression within the bone marrow Lin(−)Sca1(+)c-kit(+) stem cell compartment is accompanied by loss of self-renewal capacity. Immunity. 15:659–669 10.1016/S1074-7613(01)00220-5 - DOI - PubMed
    1. Adolfsson J., Månsson R., Buza-Vidas N., Hultquist A., Liuba K., Jensen C.T., Bryder D., Yang L., Borge O.J., Thoren L.A., et al. 2005. Identification of Flt3+ lympho-myeloid stem cells lacking erythro-megakaryocytic potential: a revised road map for adult blood lineage commitment. Cell. 121:295–306 10.1016/j.cell.2005.02.013 - DOI - PubMed
    1. Arinobu Y., Mizuno S., Chong Y., Shigematsu H., Iino T., Iwasaki H., Graf T., Mayfield R., Chan S., Kastner P., Akashi K. 2007. Reciprocal activation of GATA-1 and PU.1 marks initial specification of hematopoietic stem cells into myeloerythroid and myelolymphoid lineages. Cell Stem Cell. 1:416–427 10.1016/j.stem.2007.07.004 - DOI - PubMed
    1. Balazs A.B., Fabian A.J., Esmon C.T., Mulligan R.C. 2006. Endothelial protein C receptor (CD201) explicitly identifies hematopoietic stem cells in murine bone marrow. Blood. 107:2317–2321 10.1182/blood-2005-06-2249 - DOI - PMC - PubMed

Publication types

MeSH terms