. 2010 Aug 12;116(6):953-61.
doi: 10.1182/blood-2010-01-263806. Epub 2010 Apr 26.

Pathway discovery in mantle cell lymphoma by integrated analysis of high-resolution gene expression and copy number profiling

Affiliations

Pathway discovery in mantle cell lymphoma by integrated analysis of high-resolution gene expression and copy number profiling

Elena M Hartmann et al. Blood. .

Abstract

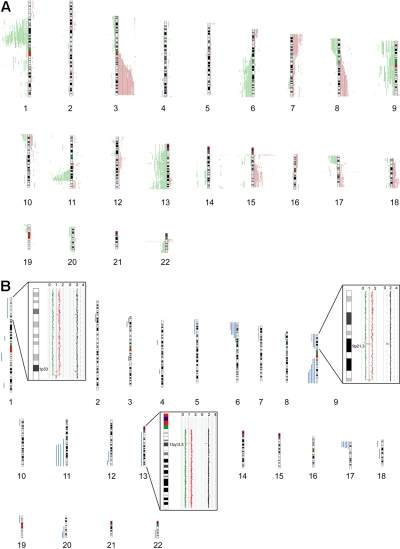
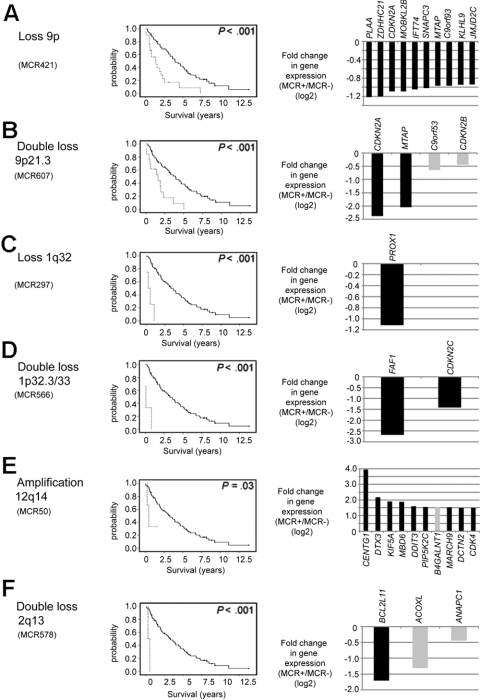
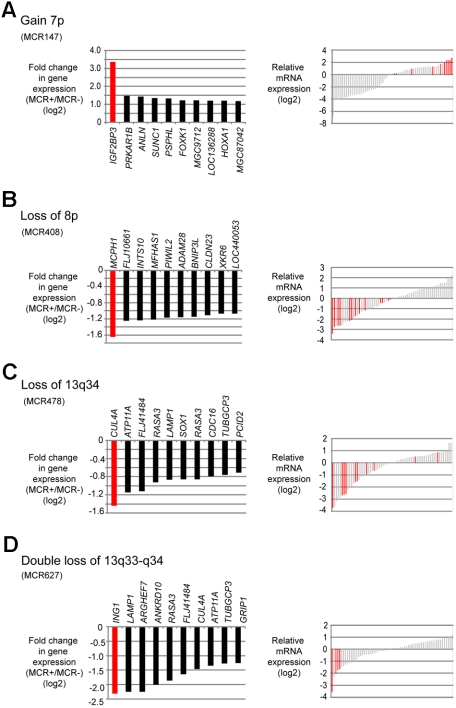
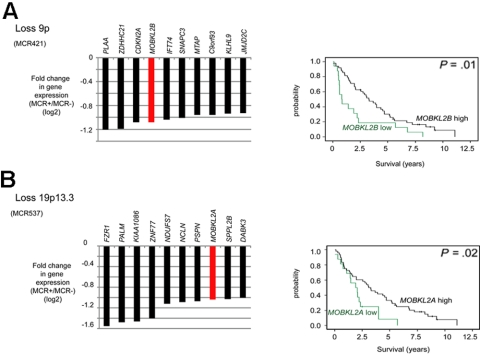
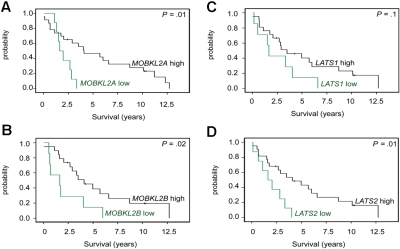
The genome of mantle cell lymphoma (MCL) is, in addition to the translocation t(11;14), characterized by a high number of secondary chromosomal gains and losses that probably account for the various survival times of MCL patients. We investigated 77 primary MCL tumors with available clinical information using high-resolution RNA expression and genomic profiling and applied our recently developed gene expression and dosage integrator algorithm to identify novel genes and pathways that may be of relevance for the pathobiology of MCL. We show that copy number neutral loss of heterozygosity is common in MCL and targets regions that are frequently affected by deletions. The molecular consequences of genomic copy number changes appear complex, even in genomic loci with identified tumor suppressors, such as the region 9p21 containing the CDKN2A locus. Moreover, the deregulation of novel genes, such as CUL4A, ING1, and MCPH1, may affect the 2 crucial pathogenetic mechanisms in MCL, the disturbance of the proliferation, and DNA damage response pathways. Deregulation of the Hippo pathway may have a pathogenetic role in MCL because decreased expression of its members MOBKL2A, MOBKL2B, and LATS2 was associated with inferior outcome, including an independent validation series of 32 MCLs.


Figures

Figure 1
Figure 1
Chromosomal alterations in 77 MCL cases determined by 500K SNP arrays. Chromosomal alterations in 72 cyclin D1–positive and 5 cyclin D1–negative primary MCL cases determined by 500K SNP arrays. (A) Copy number alterations (including putative copy number variations) according to the CNAG software. Gains are displayed in red on the right side of the ideograms, and losses are shown in green on the left side of the ideograms. (B) Regions of CNN-LOH, also termed UPD; more than 10 Mb determined by the CNAG/AsCNAR and CNAT software tools. Regions of CNN-LOH/UPD are shown in blue, and regions of uniparental trisomy are shown in purple. (Insets) Regions of partial CNN-LOH/UPD in chromosomes 1, 9, and 13 that include small regions of homozygous deletions in 1p32.3/33 (contains the genomic loci of CDKN2C and FAF1), 9p21.3 (CDKN2A locus), and 13q13.3 (containing C13orf36, RFXAP, and SMAD9), indicating that the CNN-LOH/UPD arose after the loss of one copy of the respective genomic locus. The black line indicates total gene dosage; the diploid state is indicated by 2. The red and green lines indicate allele-specific gene dosage levels, with loss of one parental copy and gain of the other in the region of partial CNN-LOH/UPD.
Figure 2
Figure 2
Chromosomal alterations associated with an unfavorable prognosis and their putative target genes. (A) Loss of 9p. (B) Double loss of 9p21.3. (C) Loss of 1q32. (D) Double loss of 1p32.3/33. (E) Amplification of 12q14. (F) Double loss of 2q13. Kaplan-Meier curves visualize survival differences between MCL patients with and without the respective CNA. (Right panels) Genes within the MCR that had the greatest difference in fold change in cases with the alteration compared with the cases without the alteration. In the gene expression panels, only genes within the core region of the respective MCR are shown. Genes with a P value more than .05 are shown in gray.
Figure 3
Figure 3
Putative target genes of frequent CNAs in MCL identified by combined SNP and gene expression profiling. (A) Gain of 7p. (B) Loss of 8p. (C) Loss of 13q34. (D) Double loss of 13q33-q34. (Left panels) Genes within each MCR that had the greatest difference in fold change in cases with the alteration compared with the cases without the alteration. (Right panels) Gene expression levels of the candidate genes in each case; red bars represent the cases with the respective CNA.
Figure 4
Figure 4
Candidate tumor suppressor genes involved in the Hippo signaling pathway in MCL identified by combined SNP and gene expression profiling. (A) Loss of 9p. (B) Loss of 19p13.3. Kaplan-Meier curves visualizing survival groups according to the mRNA expression determined by gene expression array analysis of MOBKL2B (PS 226844 on HG U133 plus 2.0) located in 9p21.2 and MOBKL2A (PS 235163) located in 19p13.3. For MCR537/loss19p13.3 genes located in the core and extended region are displayed.
Figure 5
Figure 5
Kaplan-Meier curves visualizing MCL survival groups according to the mRNA expression of Hippo pathway associated genes in a validation series. mRNA expression of (A) MOBKL2A, (B) MOBKL2B, (C) LATS1, and (D) LATS2 (cutoff ≤ 25th percentile) in an independent group of 32 untreated MCL patients. Expression was determined by quantitative RT-PCR and the comparative Ct method.

Comment in

  • Discovery of Hippo in MCL.
    Auer R. Auer R. Blood. 2010 Aug 12;116(6):861-2. doi: 10.1182/blood-2010-05-284075. Blood. 2010. PMID: 20705764 No abstract available.

Similar articles

Cited by

References

    1. Swerdlow SH, Campo E, Harris NL, et al., editors. WHO Classification of Tumours of Haematopoietic and Lymphoid Tissues. 4th ed. Lyon, France: IARC; 2008.
    1. Jares P, Colomer D, Campo E. Genetic and molecular pathogenesis of mantle cell lymphoma: perspectives for new targeted therapeutics. Nat Rev Cancer. 2007;7(10):750–762. - PubMed
    1. Rosenwald A, Wright G, Wiestner A, et al. The proliferation gene expression signature is a quantitative integrator of oncogenic events that predicts survival in mantle cell lymphoma. Cancer Cell. 2003;3(2):185–197. - PubMed
    1. Orchard J, Garand R, Davis Z, et al. A subset of t(11;14) lymphoma with mantle cell features displays mutated IgVH genes and includes patients with good prognosis, nonnodal disease. Blood. 2003;101(12):4975–4981. - PubMed
    1. Nodit L, Bahler DW, Jacobs SA, Locker J, Swerdlow SH. Indolent mantle cell lymphoma with nodal involvement and mutated immunoglobulin heavy chain genes. Hum Pathol. 2003;34(10):1030–1034. - PubMed

Publication types

MeSH terms