

Developmental regulation and individual differences of neuronal H3K4me3 epigenomes in the prefrontal cortex
- PMID: 20421462
- PMCID: PMC2889328
- DOI: 10.1073/pnas.1001702107
Developmental regulation and individual differences of neuronal H3K4me3 epigenomes in the prefrontal cortex
Abstract
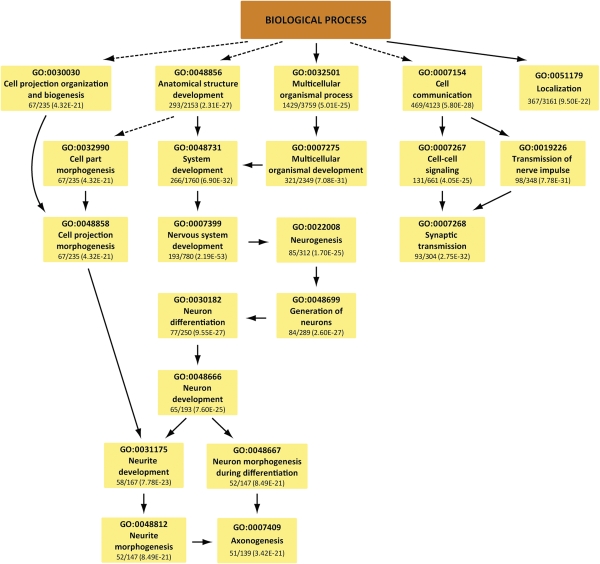
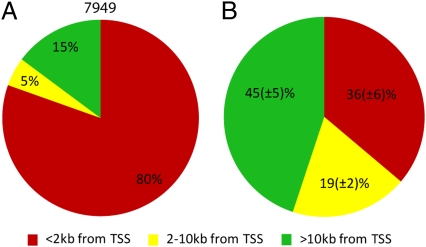
Little is known about the regulation of neuronal and other cell-type specific epigenomes from the brain. Here, we map the genome-wide distribution of trimethylated histone H3K4 (H3K4me3), a mark associated with transcriptional regulation, in neuronal and nonneuronal nuclei collected from prefrontal cortex (PFC) of 11 individuals ranging in age from 0.5 to 69 years. Massively parallel sequencing identified 12,732-19,704 H3K4me3 enriched regions (peaks), the majority located proximal to (within 2 kb of) the transcription start site (TSS) of annotated genes. These included peaks shared by neurons in comparison with three control (lymphocyte) cell types, as well as peaks specific to individual subjects. We identified 6,213 genes that show highly enriched H3K4me3 in neurons versus control. At least 1,370 loci, including annotated genes and novel transcripts, were selectively tagged with H3K4me3 in neuronal but not in nonneuronal PFC chromatin. Our results reveal age-correlated neuronal epigenome reorganization, including decreased H3K4me3 at approximately 600 genes (many function in developmental processes) during the first year after birth. In comparison, the epigenome of aging (>60 years) PFC neurons showed less extensive changes, including increased H3K4me3 at 100 genes. These findings demonstrate that H3K4me3 in human PFC is highly regulated in a cell type- and subject-specific manner and highlight the importance of early childhood for developmentally regulated chromatin remodeling in prefrontal neurons.
Conflict of interest statement
The authors declare no conflict of interest.
Figures


Similar articles
-
Epigenetic signatures of autism: trimethylated H3K4 landscapes in prefrontal neurons.Arch Gen Psychiatry. 2012 Mar;69(3):314-24. doi: 10.1001/archgenpsychiatry.2011.151. Epub 2011 Nov 7. Arch Gen Psychiatry. 2012. PMID: 22065254
-
Coordinated cell type-specific epigenetic remodeling in prefrontal cortex begins before birth and continues into early adulthood.PLoS Genet. 2013 Apr;9(4):e1003433. doi: 10.1371/journal.pgen.1003433. Epub 2013 Apr 11. PLoS Genet. 2013. PMID: 23593028 Free PMC article.
-
Human-specific histone methylation signatures at transcription start sites in prefrontal neurons.PLoS Biol. 2012;10(11):e1001427. doi: 10.1371/journal.pbio.1001427. Epub 2012 Nov 20. PLoS Biol. 2012. PMID: 23185133 Free PMC article.
-
Epigenetic landscape of amphetamine and methamphetamine addiction in rodents.Epigenetics. 2015;10(7):574-80. doi: 10.1080/15592294.2015.1055441. Epigenetics. 2015. PMID: 26023847 Free PMC article. Review.
-
Broad domains of histone H3 lysine 4 trimethylation in transcriptional regulation and disease.FEBS J. 2020 Jul;287(14):2891-2902. doi: 10.1111/febs.15219. Epub 2020 Feb 4. FEBS J. 2020. PMID: 31967712 Review.
Cited by
-
Cognition and mood-related behaviors in L3mbtl1 null mutant mice.PLoS One. 2015 Apr 7;10(4):e0121252. doi: 10.1371/journal.pone.0121252. eCollection 2015. PLoS One. 2015. PMID: 25849281 Free PMC article.
-
Epigenetics and aging.Sci Adv. 2016 Jul 29;2(7):e1600584. doi: 10.1126/sciadv.1600584. eCollection 2016 Jul. Sci Adv. 2016. PMID: 27482540 Free PMC article. Review.
-
Genetic association of cyclic AMP signaling genes with bipolar disorder.Transl Psychiatry. 2012 Oct 2;2(10):e169. doi: 10.1038/tp.2012.92. Transl Psychiatry. 2012. PMID: 23032945 Free PMC article.
-
Advancing drug discovery for schizophrenia.Ann N Y Acad Sci. 2011 Oct;1236:30-43. doi: 10.1111/j.1749-6632.2011.06216.x. Ann N Y Acad Sci. 2011. PMID: 22032400 Free PMC article.
-
Chromatin modifications associated with DNA double-strand breaks repair as potential targets for neurological diseases.Neurotherapeutics. 2013 Oct;10(4):817-30. doi: 10.1007/s13311-013-0210-9. Neurotherapeutics. 2013. PMID: 24072514 Free PMC article. Review.
References
Publication types
MeSH terms
Substances
Grants and funding
LinkOut - more resources
Full Text Sources
Other Literature Sources
Molecular Biology Databases
Miscellaneous
