. 2010 Jul;185(3):939-59.
doi: 10.1534/genetics.110.116368. Epub 2010 Apr 26.

Surprising fitness consequences of GC-biased gene conversion: I. Mutation load and inbreeding depression

Affiliations

Surprising fitness consequences of GC-biased gene conversion: I. Mutation load and inbreeding depression

Sylvain Glémin. Genetics. 2010 Jul.

Erratum in

  • Genetics. 2012 Apr;190(4):1585

Abstract

GC-biased gene conversion (gBGC) is a recombination-associated process mimicking selection in favor of G and C alleles. It is increasingly recognized as a widespread force in shaping the genomic nucleotide landscape. In recombination hotspots, gBGC can lead to bursts of fixation of GC nucleotides and to accelerated nucleotide substitution rates. It was recently shown that these episodes of strong gBGC could give spurious signatures of adaptation and/or relaxed selection. There is also evidence that gBGC could drive the fixation of deleterious amino acid mutations in some primate genes. This raises the question of the potential fitness effects of gBGC. While gBGC has been metaphorically termed the "Achilles' heel" of our genome, we do not know whether interference between gBGC and selection merely has practical consequences for the analysis of sequence data or whether it has broader fundamental implications for individuals and populations. I developed a population genetics model to predict the consequences of gBGC on the mutation load and inbreeding depression. I also used estimates available for humans to quantitatively evaluate the fitness impact of gBGC. Surprising features emerged from this model: (i) Contrary to classical mutation load models, gBGC generates a fixation load independent of population size and could contribute to a significant part of the load; (ii) gBGC can maintain recessive deleterious mutations for a long time at intermediate frequency, in a similar way to overdominance, and these mutations generate high inbreeding depression, even if they are slightly deleterious; (iii) since mating systems affect both the selection efficacy and gBGC intensity, gBGC challenges classical predictions concerning the interaction between mating systems and deleterious mutations, and gBGC could constitute an additional cost of outcrossing; and (iv) if mutations are biased toward A and T alleles, very low gBGC levels can reduce the load. A robust prediction is that the gBGC level minimizing the load depends only on the mutational bias and population size. These surprising results suggest that gBGC may have nonnegligible fitness consequences and could play a significant role in the evolution of genetic systems. They also shed light on the evolution of gBGC itself.


Figures

F<sc>igure</sc> 1.—
Figure 1.—
Deterministic equilibrium frequency of the deleterious GC allele as a function of the conversion bias for different dominance levels: h = 0.5 (thick line), h = 0.2 (thin line), h = 0.05 (dashed line), and h = 0 (dotted line). s = 0.001, u = 10−6, and λ = 2.
F<sc>igure</sc> 2.—
Figure 2.—
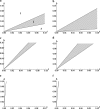
The three selection regimes as a function of b and s for different combinations of dominance levels (a, c, and e, h = 0.1; b, d, and f, h =0.3) and mating systems (a and b, F = 0; c and d, F = 0.5; e and f, F = 0.95). 1: gBGC overwhelms selection and the GC deleterious allele goes to fixation. 2: gBGC and selection are of similar intensities and an overdominance-like equilibrium is reached. 3: Selection overwhelms gBGC and the deleterious allele becomes extinct.
F<sc>igure</sc> 3.—
Figure 3.—
The load (×106) as a function of s for different effective population sizes (thick lines, N = 5000; thin lines, N = 10,000; dashed lines, N = 50,000; dotted lines, N = 100,000), without (a) or with (b–d) gBGC (b = 0.0002). The straight lines correspond to equilibrium expectations. (b) Load due to GC deleterious alleles. (c) Load averaged over half GC and half AT deleterious alleles. (d) Load averaged over 10% of GC deleterious alleles and 90% of AT deleterious alleles with a bias in favor of AT alleles. This last case would correspond to the load caused by third codon position mutations under codon usage selection, mainly in favor of GC alleles. h = 0.5, u = 10−6, and λ = 2.
F<sc>igure</sc> 4.—
Figure 4.—
Inbreeding depression (×106) as a function of s without (a and c) or with (b and d) gBGC (b = 0.0002). (a and b) h = 0.2: thick lines, N = 5000; thin lines, N = 10,000; dashed lines, N = 50,000; dotted lines, N = 100,000. (c and d) N = 10,000: thick lines, h = 0.4; thin lines, h = 0.2; dashed lines, h = 0.1; dotted lines, h = 0.05. u = 10−6, λ = 2.
F<sc>igure</sc> 5.—
Figure 5.—
Effective population size (a and b) and the load (×106) (c–f) as a function of F for different gBGC intensities (thick lines, b = 0; thin lines, b = 0.0001; dashed lines, b = 0.0002; dotted lines, b = 0.0005). The effective population size depends on F under the background selection (BS) model (Charlesworth et al. 1993), using Equations 16 and 17 in Glémin (2007): formula image, where U is the genomic deleterious mutation rate, R is the genomic recombination rate, sd is the mean selection coefficient against strongly deleterious mutations, and hd is their dominance coefficient. N = 10,000, U = 0.2, hd = 0.1, and sd = 0.05. (a, c, and e) R = 5, “weak” BS; (b, d, and f) R = 0.5, “strong” BS. (c and d) Load averaged over half GC and half AT deleterious alleles, with a bias in favor of AT alleles. (e and f) Load averaged over 10% of GC deleterious alleles and 90% of AT deleterious alleles with a bias in favor of AT alleles; see Figure 3. h = 0.5, u = 10−6, and λ = 2.
F<sc>igure</sc> 6.—
Figure 6.—
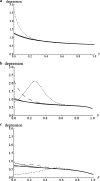
Inbreeding depression (×106) as a function of F for different gBGC intensities (thick lines, b = 0; thin lines, b = 0.0001; dashed lines, b = 0.0002; dotted lines, b = 0.0005). Inbreeding depression is averaged over half GC and half AT deleterious alleles. The effective population size depends on F as in Figure 5 (same parameters). (a) s = 0.002; (b) s = 0.0005; (c) s = 0.0002. h = 0.2, u = 10−6, and λ = 2.
F<sc>igure</sc> 7.—
Figure 7.—
Effect of gBGC on the load structure. The gamma-shaped curve represents the distribution of selection coefficients, s. Deleterious mutations can either segregate in low frequency (open part), go to fixation because of gBGC (shaded part), or go to fixation because of drift (solid part). Compared to classical predictions without gBGC, gBGC adds the shaded part. Drift load sensu stricto and segregating load are also affected by gBGC but very weakly. In small populations (a), the drift load is higher and the gBGC fixation load lower than in large populations (b).
F<sc>igure</sc> D1.—
Figure D1.—
N = 10,000; b = 0, b = 2 × 10⁻³, b = 2 × 10⁻⁴, b = 5 × 10⁻⁵ (from left to right).
F<sc>igure</sc> D2.—
Figure D2.—
b = 2 × 10⁻⁴ ; s = 10−2, s = 10−3, s = 10−4, s = 10−5 (from top left to bottom left).

Similar articles

Cited by

References

    1. Abramowitz, M., and I. A. Stegun, 1970. Handbook of Mathematical Functions. Dover, New York.
    1. Bataillon, T., and M. Kirkpatrick, 2000. Inbreeding depression due to mildly deleterious mutations in finite populations: size does matter. Genet. Res. 75 75–81. - PubMed
    1. Bengtsson, B. O., 1990. The effect of biased conversion on the mutation load. Genet. Res. 55 183–187. - PubMed
    1. Bengtsson, B. O., and M. K. Uyenoyama, 1990. Evolution of the segregation ratio: modification of gene conversion and meiotic drive. Theor. Popul. Biol. 38 192–218. - PubMed
    1. Berglund, J., K. S. Pollard and M. T. Webster, 2009. Hotspots of biased nucleotide substitutions in human genes. PLoS Biol. 7 e26. - PMC - PubMed

Publication types