. 2010 Jul;185(3):727-44.
doi: 10.1534/genetics.109.113753. Epub 2010 Apr 26.

A fluorescence in situ hybridization system for karyotyping soybean

Affiliations

A fluorescence in situ hybridization system for karyotyping soybean

Seth D Findley et al. Genetics. 2010 Jul.

Abstract

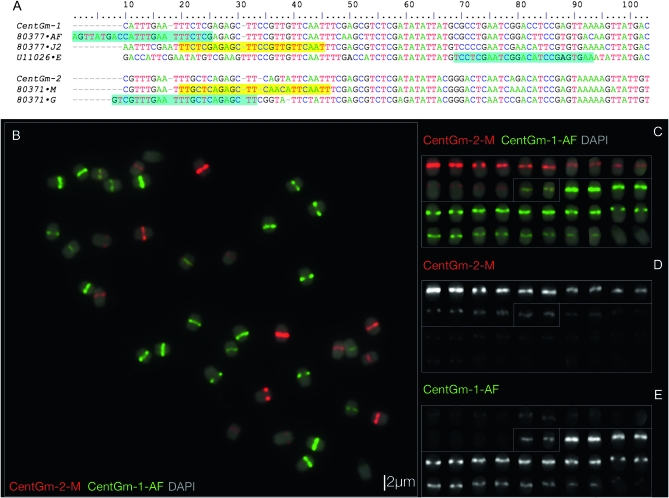
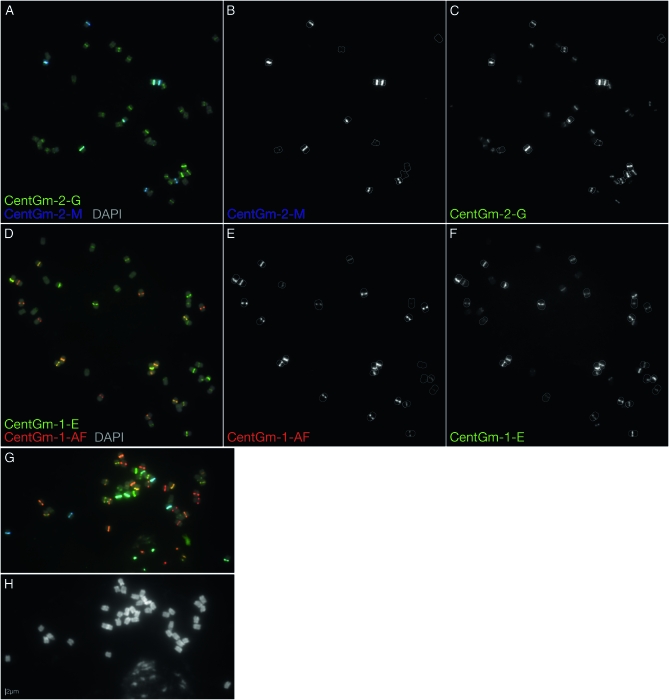
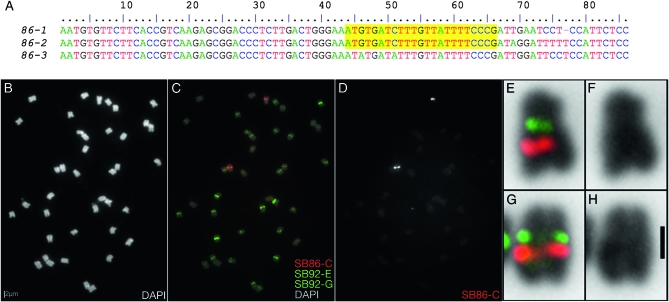
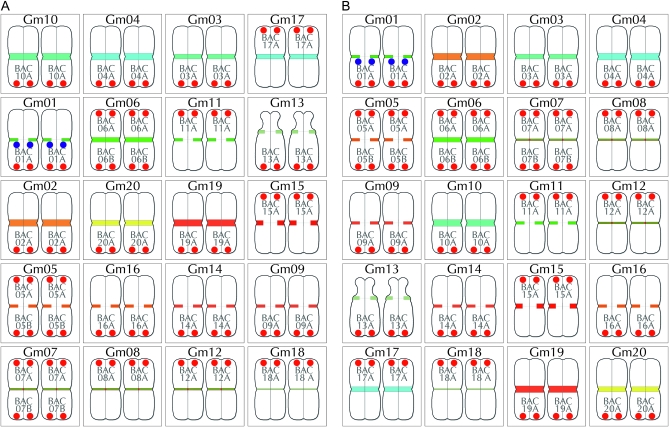
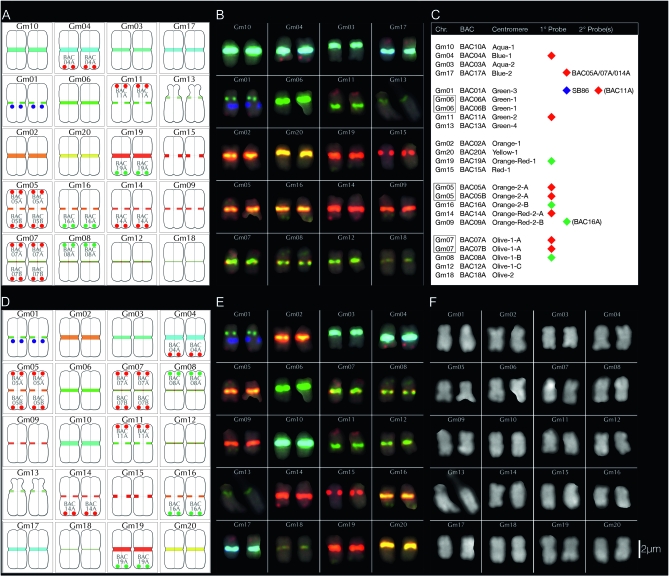
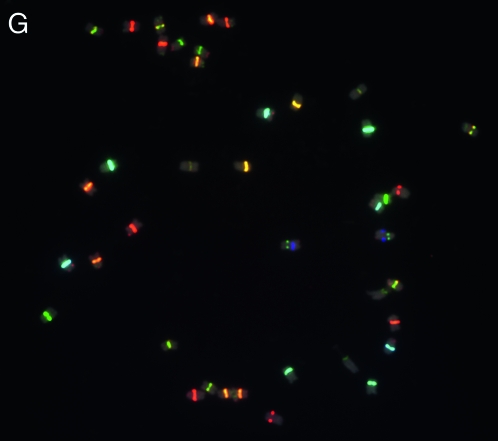
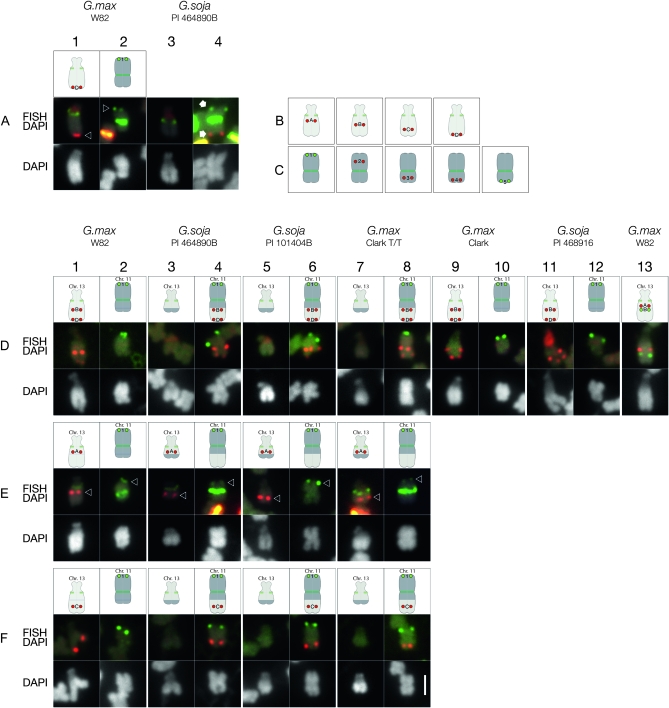
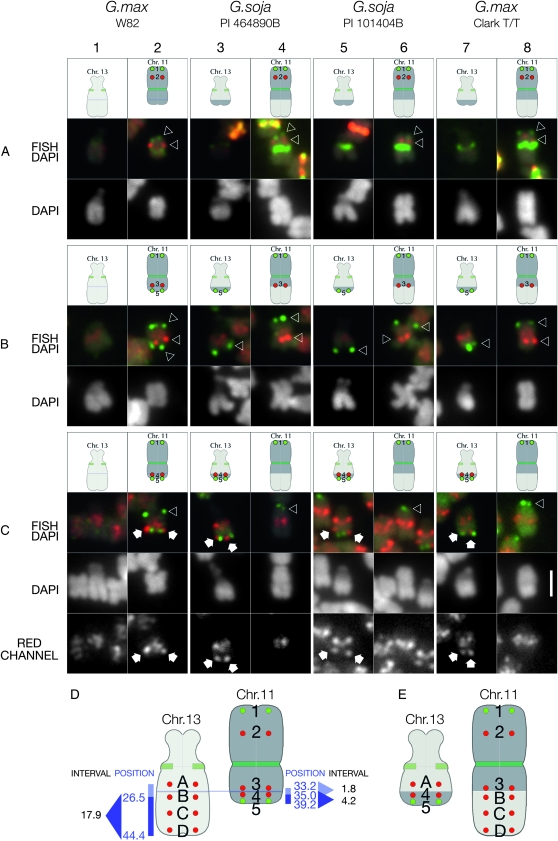
The development of a universal soybean (Glycine max [L.] Merr.) cytogenetic map that associates classical genetic linkage groups, molecular linkage groups, and a sequence-based physical map with the karyotype has been impeded due to the soybean chromosomes themselves, which are small and morphologically homogeneous. To overcome this obstacle, we screened soybean repetitive DNA to develop a cocktail of fluorescent in situ hybridization (FISH) probes that could differentially label mitotic chromosomes in root tip preparations. We used genetically anchored BAC clones both to identify individual chromosomes in metaphase spreads and to complete a FISH-based karyotyping cocktail that permitted simultaneous identification of all 20 chromosome pairs. We applied these karyotyping tools to wild soybean, G. soja Sieb. and Zucc., which represents a large gene pool of potentially agronomically valuable traits. These studies led to the identification and characterization of a reciprocal chromosome translocation between chromosomes 11 and 13 in two accessions of wild soybean. The data confirm that this translocation is widespread in G. soja accessions and likely accounts for the semi-sterility found in some G. soja by G. max crosses.


Figures

F<sc>igure</sc> 1.—
Figure 1.—
Sequence and localization analysis of CentGm repeats in G. max W82. (A) ClustalW alignment of consensus DNA sequences of the most abundant CentGm family repeats identified by Swaminathan et al. (2007), together with U11026, a CentGm variant identified by Vahedian et al. (1995), in addition to CentGm-1 and CentGm-2, monomers identified by Gill et al. (2009). Two major CentGm repeat subtypes are evident: a 92-bp class (upper) and a 91-bp subtype (lower). Oligonucleotide probes used to target individual repeats are indicated after the sequence names (e.g. “·AF,” with a corresponding probe name of CentGm-AF). Oligonucleotide probes identical to a given sequence are indicated by yellow background, whereas those that are reverse complements are indicated by aqua background. Probes ·AF and ·G would each hybridize across the junction of two monomers; thus, the sequences are duplicated for these regions. Oligonucleotides CentGm-1-AF and CentGm-1-J2 target 24- or 25-bp sequences, respectively, conserved among members of the 92-bp repeat subtype, and oligonucleotide CentGm-1-E targets a specific variant of the 92-bp subtype. Oligonucleotide CentGm-2-M targets a consensus 25-bp sequence conserved among a fraction of the 91-bp repeat subtypes, whereas oligonucleotide CentGm-2-G targets a consensus 25-bp sequence conserved among most of the abundant 91-bp variants. (B–E) FISH of G. max W82 chromosomes with fluorochrome-tagged oligonucleotide probes targeting 91- and 92-bp CentGm repeats. The following oligonucleotide probes (amounts) were used per slide: fluorescein-CentGm-1-AF (20 ng) Texas red-615-CentGm-2-M (20 ng). (B) Chromosome spread probed with a red-fluorochrome-tagged CentGm-2-M oligonucleotide and a green-fluorochrome-tagged CentGm-1-AF oligonucleotide. The DAPI signal is included as a 25% intensity gray-scale channel to delineate chromosomes. (C) Individual chromosomes from B arrayed generally by color and intensity of CentGm hybridization signal. (D) The red channel (CentGm-2-M), excluding DAPI, of the chromosome array in C. (E) The green channel (CentGm-1-AF), excluding DAPI, of the chromosome array in C. Three types of chromosomes are apparent: 7 pairs (upper chromosomes in C–E) that hybridize predominantly to the red CentGm-2-M probe, 12 pairs (lower chromosomes in C–E) that hybridize to the green CentGm-1-AF probe, and a single pair (boxed in center in C–E) that hybridizes equally to both probes. Bar in B is also valid for C–E.
F<sc>igure</sc> 2.—
Figure 2.—
Localization of 91- and 92-bp CentGm repeat variants in G. max W82. (A–F) FISH of G. max W82 chromosomes with fluorochrome-tagged oligonucleotide probes targeting 91-bp (CentGm-2) and 92-bp (CentGm-1) CentGm repeats, either within the 91-bp class (A–C) or within the 92-bp class (D–F). (A) Cy5 (pseudocolored blue)-labeled CentGm-2-M oligonucleotide targets a subset of chromosomes that largely overlaps those targeted by the green-labeled CentGm-2-G oligonucleotide. (B) Gray-scale image of the CentGm-2-M fluorescent channel, excluding DAPI, of the chromosomes in A. All chromosomes (7 pairs are detectable with the Cy5-labeled CentGm-2-M probe at this exposure) with hybridization signal are outlined. (C) Gray-scale image of the CentGm-2-G fluorescent channel, excluding DAPI, of the chromosomes in A. The CentGm-2-M-hybridizing chromosomes from B are outlined. Several additional chromosome pairs are detected by the CentGm-2-G probe. (D) The red-labeled CentGm-1-AF probe targets a subset of chromosomes that largely overlaps those targeted by the green-labeled CentGm-1-E probe. (E) Gray-scale image of the CentGm-1-AF fluorescent channel, excluding DAPI, of the chromosomes in D. All chromosomes (13 pairs) with detectable hybridization signal are outlined. (F) Gray-scale image of the CentGm-1-E fluorescent channel, excluding DAPI, of the chromosomes in D. The CentGm-1-AF-hybridizing chromosomes from E are outlined. Several additional chromosome pairs are detected by the CentGm-1-E probe. (G and H) Four-component CentGm probe FISH cocktail. (G) FISH using a combination of four probes: two (CentGm-2-M and CentGm-2-G) for the 91-bp CentGm class and two (CentGm-1-AF and CentGm-1-E) for the 92-bp CentGm class. The following oligonucleotide probes (amounts) were used per slide: CY5-CentGm-2-M (7.5 ng), fluorescein-CentGm-2-G (20 ng), Texas red-615-CentGm-1-AF (0.01 ng), and fluorescein-CentGm-1-E (20 ng). (H) DAPI channel from the image in G. In addition to the condensed metaphase chromosomes, a portion of an intact nucleus is evident at the bottoms of G and H. In A, D, and G, DAPI signal is included as a 25% intensity gray-scale channel to delineate chromosomes. Bar in H is valid for all FISH panels.
F<sc>igure</sc> 3.—
Figure 3.—
Characterization of a novel 86-bp repeat in G. max W82. (A) ClustalW alignment of consensus sequences of a novel 86-bp repeat, indicating the conserved sequence (SB86-C, highlighted yellow) targeted for FISH. (B) DAPI-stained chromosomes for FISH in C–H. (C) FISH using a Texas red-tagged oligonucleotide targeting a conserved sequence within the repeat, plus two fluorescein-tagged CentGm probes and 25% DAPI signal. (D) Gray-scale image of the SB86-C fluorescent channel, excluding DAPI, of the chromosomes in C. (E–H) Enlargements of the two chromosomes with strong SB86 probe hybridization from C, with the DAPI signal inverted to black. E and G include SB86 signal together with enhanced CentGm signals. The CentGm signals correspond to the primary constrictions of the two chromosomes, which are more evident in F and H, which show DAPI without the FISH channels. The following oligonucleotide probes (amounts) were used: Texas red-SB86-C (10 ng), fluorescein-CentGm-2-G (20 ng), and fluorescein-CentGm-1-E (20 ng). Bar in B is also valid for C and D. Bar in H, 1 μm and also valid for E–G.
F<sc>igure</sc> 4.—
Figure 4.—
Summary of BACs used for chromosome assignments. Pseudomolecule-derived BACs were individually mapped by FISH onto G. max W82 chromosomes labeled with the CentGm/SB86 probe cocktail (Figure 2G). BAC signals (paired red dots) are labeled in shorthand (see Table 1) and positioned either at the top of a chromosome pair (for BACs at a low bp position in the pseudomolecule) or at the bottom (for BACs at a high position). The paired blue dots on Gm01 indicate SB86 repeat hybridization signal. With the exception of the satellite chromosome (Gm13), relative chromosome dimensions are not indicated. (A) Diagram in which chromosomes are arranged by color/intensity of FISH centromere signal. The top three rows contain chromosomes with unique CentGm/SB86 labeling, whereas the lower two rows contain groups of chromosomes with more similar centromere labeling. (B) Diagram in which chromosomes are arranged by chromosome number.
F<sc>igure</sc> 5.—
Figure 5.—
FISH-based karyotyping cocktail for G. max W82. The CentGm/SB86 oligonucleotide probe cocktail supplemented with 10 BAC probes permits discrimination of each of the 20 chromosome pairs. Chromosomes are arrayed by centromere color groups in A–C and by chromosome number in D–F. (A and D) are diagrams of the FISH images in B and E, respectively, in which centromere regions are depicted according to the color and size of CentGm probe hybridization signal under collection conditions optimized for centromere signals. In A and D, the blue dots on Gm01 indicate SB86-C probe hybridization. (C) Chart indicating how BAC probes were used to distinguish between members of chromosome groups with similar centromere signals. Chr, chromosome; BAC, BAC clone(s) used to identify an individual chromosome (see Figure 4); centromere, color (e.g., aqua) and relative intensity (e.g., 1 > 2A = 2B) of centromere signal. For example, Gm10, the brightest aqua-colored centromere, and Gm03, the second-brightest aqua-colored centromere are coded aqua-1 and aqua-2, respectively. 1°probe, the 10 BAC probes used in the cocktail and their respective fluorochrome colors; 2°probe, the presence of detectable secondary signal(s) on a given chromosome due to cross-hybridization by 1°probe probe(s). For example, BAC05A, BAC07A, and BAC014A, each used as a 1°probe to label their respective chromosomes, also cross-hybridize to Gm17; unlike these BACs, the secondary signals from BAC11A and BAC16A were not essential for the cocktail. SB86 indicates the SB86-C oligonucleotide probe. (F) DAPI channel of chromosomes in E; the short arm of Gm13 appears compact in the left chromosome and distended in the right chromosome. (G) Original image for chromosomes in B, E, and F; for DAPI channel and larger version of the image in G, see Figure S3. In B, E, and G, DAPI signal is included as a 25% intensity gray-scale channel to delineate chromosomes. The 15-probe karyotyping cocktail for G. max W82 used the following oligonucleotide probes (amount per slide): CY5-CentGm-2-M (7.5 ng), fluorescein-CentGm-2-G (20 ng), Texas red-615-CentGm-1-AF (0.01 ng), fluorescein-CentGm-1-E (20 ng), and CY5-SB86-C (20 ng) in combination with the following Texas red-labeled BAC probes (0.5 μl per slide) GM_WBb0021C24, GM_WBb0040D01, GM_WBb0051I24, GM_WBb0076F20, GM_WBb0114J08, GM_WBb0139K20, GM_WBb0173E04 and fluorescein-labeled BAC probes (1 μl per slide): GM_WBb0053C02, GM_WBb0096N20, and GM_WBb0143B15. Bar in F is also valid for B, E, and G.
F<sc>igure</sc> 6.—
Figure 6.—
Mapping Gm13 pseudomolecule-derived BAC FISH probes in G. max and G. soja accessions. (A) In G. max W82, the karyotyping BAC probe for Gm13 (labeled “D” in the diagram, corresponding to the FISH panel in column 1) hybridizes to a distal position (arrowhead) on the long arm of Gm13, the satellite chromosome; whereas the BAC probe for Gm11 (labeled “1” in column 2), hybridizes to a distal position (arrowhead) on the long arm of Gm11. In P.I. 464890B (columns 3 and 4), both probes hybridize (arrows) to opposite ends of a single chromosome (column 4) that does not have a satellite. Additional FISH signals in these images are derived from centromere-hybridizing CentGm repeat probes and a ribosomal DNA probe (red signal on the satellite arms). (B) Gm13 pseudomolecule-derived BAC probes used for chromosome mapping: “A,” GM_WBc0172G08; “B,” GM_WBb0071K05; “C,” GM_WBb0102G11; and “D,” GM_WBb0036C23. (C) Gm11 pseudomolecule-derived BAC probes used for chromosome mapping: “1,” GM_WBb0021C24; “2,” GM_WBc0087G10; “3,” GM_WBc0230E21; “4,” GM_WBc0128E05; and “5,” GM_WBc0205I11. (D–F) Mapping Gm13 pseudomolecule-derived BAC FISH probes in G. max and G. soja accessions. In each experimental series (rows D, E, and F), Gm11 probe 1 (labeled in green), was hybridized in combination with one or two Gm13 probes (labeled in red). (D) Gm13 probes B and D hybridize (FISH/DAPI row) to a chromosome segment on the long arm of the satellite chromosome (Gm13) of G. max W82 (column 1), Clark (column 9), and P.I. 468916 (column 11). In P.I. 464890B (column 4), P.I. 101404B (column 6) and Clark T/T (column 8), these probes are associated with a chromosome targeted by Gm11 probe 1, rather than with the satellite chromosome. By DAPI staining, the long arm of the satellite chromosome appears shorter, and the arm opposite the Gm11-marked arm appears longer in P.I. 464890B (column 3), P.I. 101404B (column 5), and Clark T/T (column 7) than in the corresponding chromosomes of G. max W82 (column 1), Clark (column 9), and P.I. 468916 (column 11). (E) Gm13 probe A hybridizes (red signal, indicated by arrowhead) to a centromere-proximal position on the long arm of the satellite chromosome in G. max W82 (column 1), P.I. 464890B (column 3), P.I. 101404B (column 5), and Clark T/T (column 7). The signal from Gm11 probe 1 is indicated by arrowheads in columns 2, 4, 6, and 8. Additional FISH signals in the FISH/DAPI images are derived from centromere-hybridizing CentGm repeat probes. (F) Gm13 probe C, an additional Gm13 long arm marker positioned between BACs B and D in the Gm13 pseudomolecule, localizes to the long arm of Gm13 in G. max W82 (column 1), and to the Gm11 probe 1 target in P.I. 464890B (column 4), P.I. 101404B (column 6), and Clark T/T (column 8). The following oligonucleotide probes (amounts) were used: CY5-CentGm-2-M (7.5 ng), fluorescein-CentGm-2-G (20 ng), Texas red-615-CentGm-1-AF (0.01 ng), fluorescein-CentGm-1-E (20 ng), CY5-SB86-C (20 ng), and Texas red-615-rDNA (10 ng). Bar in row F, column 8, DAPI panel is 2 μm and valid for all FISH and DAPI panels.
F<sc>igure</sc> 7.—
Figure 7.—
Mapping Gm11 pseudomolecule-derived BAC FISH probes in G. max and G. soja accessions. In each experimental series (rows A, B, and C), Gm11 BAC probe 1, (terminal upper probe, labeled in green), was hybridized in combination with one or two additional Gm11 probes to evaluate chromosome structure. (A) Gm11 probe 2 (red signals indicated by lower arrowhead) hybridizes approximately midway between Gm11 probe 1 (green signals indicated by upper arrowhead) and the centromere (targeted by CentGm repeat probes) in G. max W82 (column 2), P.I. 464890B (column 4), P.I. 101404B (column 6), and Clark T/T (column 8). No BAC-derived signal hybridizes to the satellite chromosome in any accession. (B) Gm11 probe 3 (red signals indicated by arrowheads) hybridizes at a centromere-proximal position on the arm opposite to the one with Gm11 probe 1 in G. max W82 (column 2), P.I. 464890B (column 4), P.I. 101404B (column 6), and Clark T/T (column 8). However, BAC probe 5, which hybridizes to a terminal position on the short arm of chromosome 11 in G. max W82 (green signals indicated by lower arrowhead in column 2), localizes to the long arm of chromosome 13 in P.I. 464890B (column 3), P.I. 101404B (column 5), and Clark T/T (column 7). The additional, low-level diffuse red signal in these images is the result of cross-hybridization of probe 3 with pericentromeric regions of all chromosomes. (C) Gm11 BAC probe 4, which is 1.8 Mb distal to probe 3 (above) in the Gm11 pseudomolecule, hybridizes (white arrows) close to probe 5 (lower green signals), near the terminus of the short arm of Gm11 in G. max W82 (column 2). However, in P.I. 464890B (column 3), P.I. 101404B (column 5), and Clark T/T (column 7), the BAC 4 probe hybridizes to a distal position on the long arm of chromosome 13. Due to the high repeat content of probe 4, there is significant cross-hybridization to pericentromeric regions of all chromosomes. Therefore, the red channel from each FISH/DAPI panel is included as a separate gray-scale image (RED CHANNEL) below. The only discrete, nonpericentromeric probe 4 hybridization is restricted to chromosome 11 in G. max W82 (column 2) and to chromosome 13 in P.I. 464890B (column 3), P.I. 101404B (column 5), and Clark T/T (column 7). (D) Summary of G. max W82 BAC probes used to map the reciprocal translocation between chromosomes 13 and 11 in other accessions. Position, the position in megabases of the central base pairs of a given BAC (Table S1for details) in the respective pseudomolecule for a given chromosome; interval, numbers represent the window in megabases between BAC probe position numbers. Gm13 BAC probe B is at 26.5 Mb, D is at 43.0 Mb (not indicated), and the 3′ end of the Gm13 pseudomolecule is at 44.4 Mb. The position of probe A is undetermined. Thus, a fragment of chromosome 13 at least 17.9 Mb long has exchanged with an ∼4.2-Mb fragment of chromosome 11 in P.I. 464890B, P.I. 101404B, and Clark T/T, resulting in the chromosomes in E. The following oligonucleotide probes (amounts) were used: CY5-CentGm-2-M (7.5 ng), fluorescein-CentGm-2-G (20 ng), Texas red-615-CentGm-1-AF (0.01 ng), fluorescein-CentGm-1-E (20 ng), CY5-SB86-C (20 ng), and Texas red-615-rDNA (10 ng). Bar in row C, column 8, DAPI panel is 2 μm and valid for all FISH and DAPI panels.

Similar articles

Cited by

References

    1. Ahmad, Q. N., E. J. Britten and D. E. Byth, 1983. A quantitative method of karyotypic analysis applied to the soybean, Glycine max. Cytologia 48 879–892.
    1. Ahmad, Q. N., E. J. Britten and D. E. Byth, 1984. The karyotype of Glycine soja and its relationship to that of the soybean, Glycine max. Cytologia 49 645–658.
    1. Altschul, S. F., W. Gish, W. Miller, E. W. Myers and D. J. Lipman, 1990. Basic local alignment search tool. J. Mol. Biol. 215 403–410. - PubMed
    1. Ananiev, E. V., R. L. Phillips and H. W. Rines, 1998. Chromosome-specific molecular organization of maize (Zea mays L.) centromeric regions. Proc. Natl. Acad. Sci. USA 95 13073–13078. - PMC - PubMed
    1. Arumuganathan, K., and E. D. Earle, 1991. Nuclear DNA content of some important plant species. Plant Mol. Biol. Rep. 9 208–218.

Publication types