. 2010 Apr 22;6(4):e1000858.
doi: 10.1371/journal.ppat.1000858.

Rhomboid 4 (ROM4) affects the processing of surface adhesins and facilitates host cell invasion by Toxoplasma gondii

Affiliations

Rhomboid 4 (ROM4) affects the processing of surface adhesins and facilitates host cell invasion by Toxoplasma gondii

Jeffrey S Buguliskis et al. PLoS Pathog. .

Abstract

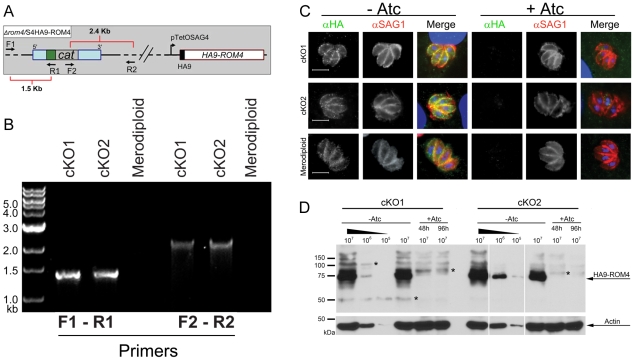
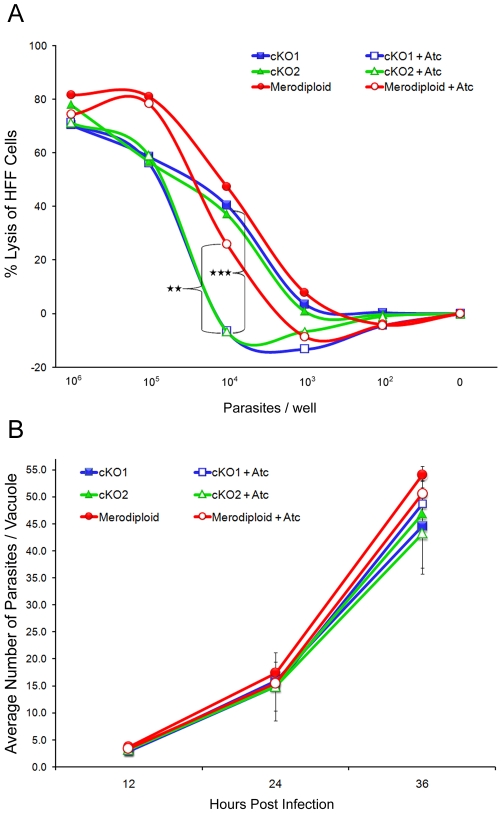
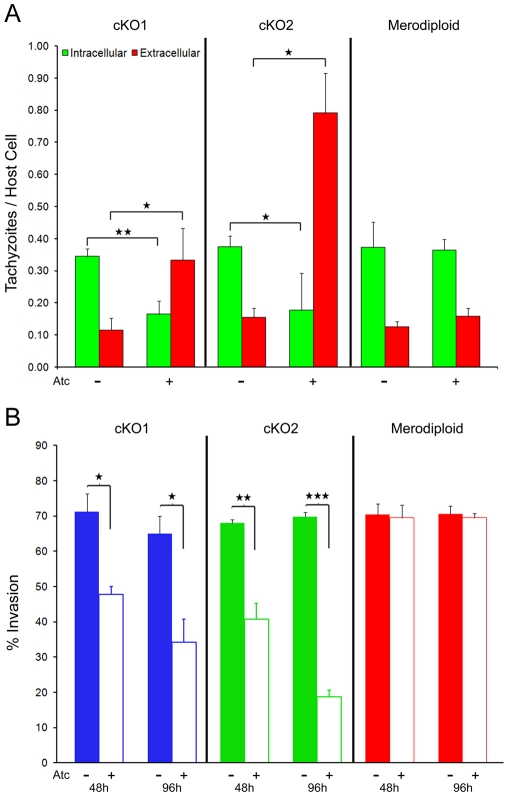
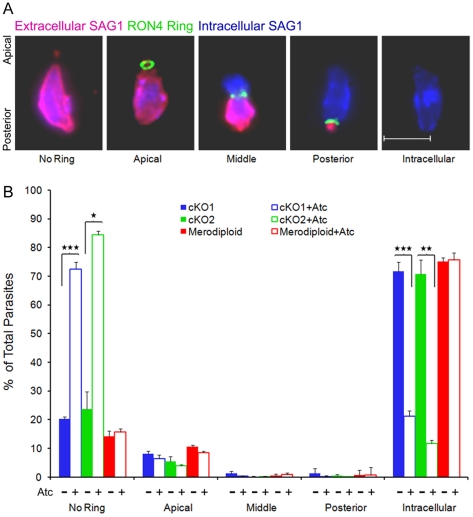
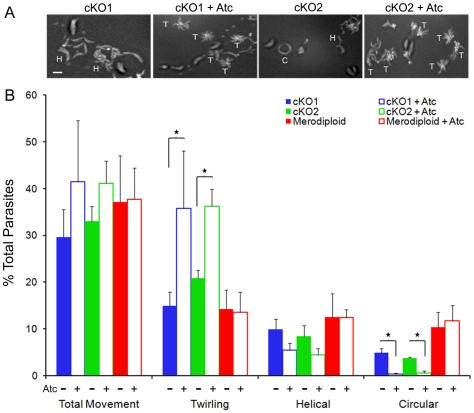
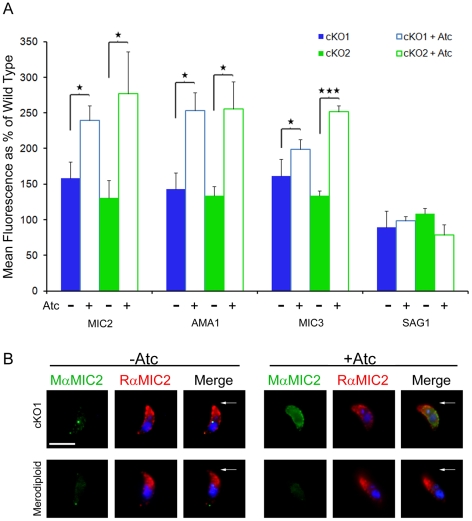
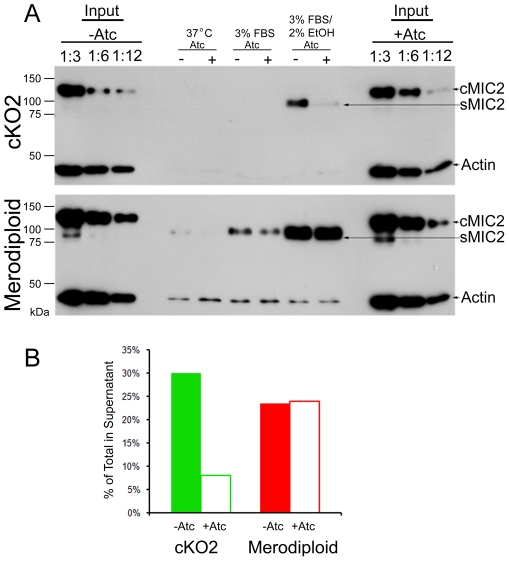
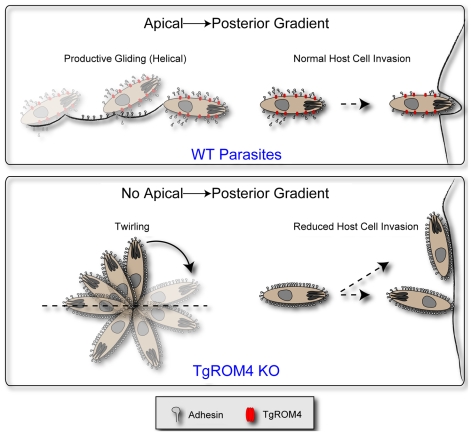
Host cell attachment by Toxoplasma gondii is dependent on polarized secretion of apical adhesins released from the micronemes. Subsequent translocation of these adhesive complexes by an actin-myosin motor powers motility and host cell invasion. Invasion and motility are also accompanied by shedding of surface adhesins by intramembrane proteolysis. Several previous studies have implicated rhomboid proteases in this step; however, their precise roles in vivo have not been elucidated. Using a conditional knockout strategy, we demonstrate that TgROM4 participates in processing of surface adhesins including MIC2, AMA1, and MIC3. Suppression of TgROM4 led to decreased release of the adhesin MIC2 into the supernatant and concomitantly increased the surface expression of this and a subset of other adhesins. Suppression of TgROM4 resulted in disruption of normal gliding, with the majority of parasites twirling on their posterior ends. Parasites lacking TgROM4 bound better to host cells, but lost the ability to apically orient and consequently most failed to generate a moving junction; hence, invasion was severely impaired. Our findings indicate that TgROM4 is involved in shedding of micronemal proteins from the cell surface. Down regulation of TgROM4 disrupts the normal apical-posterior gradient of adhesins that is important for efficient cell motility and invasion of host cells by T. gondii.


Conflict of interest statement

The authors have declared that no competing interests exist.

Figures

Figure 1
Figure 1. Generation of a conditional knockout of TgROM4.
Genetic confirmation of the conditional knockout (cKO) of TgROM4. (A) Diagram of the cKO genotype. On the right, the Tet-repressible allele of HA-9 tagged ROM4 (HA9-ROM4) is controlled by the pTetOSAG4 promoter. On the left, the endogenous gene has been replaced by the cat selectable marker driven by the SAG1 promoter (green box) and flanked by 5′ and 3′ regions of TgROM4 (blue boxes). Position of primers used to verify the proper integration of the knockout cassette are shown by arrows. (B) PCR analysis of two cKO clones (cKO1 and cKO2). Primer pairs F1-R1 and F2-R2 can only generate products following the successful replacement of the endogenous gene with the cat cassette. Merodiploid line was used as a negative control. (C) Immunofluorescence staining of HA9-ROM4 suppression following a total of 72h growth in 1.5 µg/ml of Atc. HA9-ROM4 was detected using mouse anti-HA followed by goat anti-mouse IgG Alexa 488 (green), followed by mouse anti-SAG1 directly conjugated to Alexa 594 (red). Parasite and host cell nuclei were visualized with DAPI (blue). Scale bar = 5 µm. (D) Western blot analysis with mAb against the HA9 tag showing suppression of HA9-TgROM4 following culture in presence of Atc for 48 or 96h. Western blotting was performed on parasite lysates using mAb against HA9. Rabbit anti-actin was used as a loading control. Asterisks denote minor cross-reactive bands.
Figure 2
Figure 2. Intracellular growth is unaffected in TgROM4 conditional knockouts.
Growth in human cells was monitored in vitro using two standard assays. (A) Host cell monolayer integrity was observed following 96h parasite growth in 1.5 µg/ml of Atc. Absorbance at 570 nm of crystal violet-stained host cells was used to calculate % lysis of host cells at specific parasite concentrations/well. Results obtained from conditional knockouts cKO1 (blue lines) and cKO2 (green lines) were plotted and compared to parasites in the absence (closed symbols) and presence (open symbols) of Atc. Parental merodiploid parasites (red lines) were used as a control. Values represent mean, n = 4 replicates each from two pooled experiments. ** P≤0.005, *** P≤0.001 (B) Intracellular growth during a single infectious cycle. The number of intracellular parasites/vacuole was quantified during a single intracellular cycle, following 96h pregrowth in 1.5 µg/ml of Atc vs. control. Samples were taken every 12h, fixed for IF and quantified by counting the number of parasites/vacuole. Values represent means ± SD, n = 3, from a representative experiment.
Figure 3
Figure 3. Host cell invasion is impaired in TgROM4 conditional knockouts.
(A) Comparison of the invasion efficient of cKO clones vs. the merodiploid. Invasion into HFF monolayers grown on coverslips was determined by microscopic examination and counting the number of extracellular (red bars) vs. intracellular (green bars) parasites following staining with antibodies to the parasite cell surface (see methods). The invasion assay was conducted using a 15 min pulse-invasion assay after pretreatment with 1.5 µg/ml Atc (+Atc) vs. control (−Atc) for 96h. Values represent means ± SD, n = 3, from a representative experiment. (B) Comparison of cKOs and parental merodiploid parasites in the absence (closed bars) and presence (open bars) of Atc. Invasion efficiency is expressed as % of total parasites. Assays were conducted following 48h or 96h of pretreatment with 1.5 µg/ml Atc (+Atc) vs. control (−Atc). Values represent means ± SEM, n = 3 experiments. * P≤0.05, ** P≤0.005, *** P≤0.001.
Figure 4
Figure 4. Formation of the moving junction during parasite invasion is diminished in TgROM4 conditional knockouts.
Invasion was quantified based on the ability of the parasite to form a moving junction as defined by TgRON4 immunofluorescence staining. Progression into the host cell was based on the position of the RON4 ring; apical, middle, posterior, or fully intracellular. Adherent parasites that did not invade where classified as “no ring”. (A) Representative images of the stages of junction formation during host cell invasion. RON4 was visualized with rabbit anti-TgRON4 followed by goat anti-rabbit Alexa 488 (green). DG52 Alexa 594 (red) was used to stain extracellular parasites, while DG52 Alexa 350 (blue) was used after permeablization to stain all parasites. (B) Results from conditional knockout parasites, cKO1 (blue) and cKO2 (green), and parental merodiploid parasites (red) were classified based on the respective categories described above. Invasion was compared between parasites grown in the absence (closed bars) and presence (open bars) of 1.5 µg/ml Atc for 96h. Values represent means ± SEM, n = 3 experiments. * P≤0.05, ** P≤0.005, *** P≤0.001.
Figure 5
Figure 5. Gliding motility is altered in TgROM4 conditional knockouts.
Comparison of cKO and merodiploid lines by time-lapse video microscopy. (A) Merged video frames from time-lapse images of gliding tachyzoites (∼1 min video taken at ∼1 frame/sec and merged into a composite image). Representative patterns are labeled: H, helical glide; C, circular glide; T, twirling. See also supplemental videos S1, S2, S4, S4. (B) Patterns for the conditional knockout parasites, cKO1 (blue) and cKO2 (green), and parental merodiploid parasites (red) were defined as described above from a series of time-lapse images. Comparisons were made between parasites grown in the absence (closed bars) and presence (open bars) of Atc for 96h. Results are displayed as % of total parasites. Values represent means ± SEM, n = 3 or more experiments. * P≤0.05.
Figure 6
Figure 6. Micronemal adhesins are upregulated on the surface of the TgROM conditional knockout.
(A) Tachyzoites were screened for changes in the levels of surface proteins using antibodies specific for TgMIC2, MIC3 and AMA1, followed by goat anti-mouse IgG conjugated to Alexa 488 and analysis by flow cytometry. Surface SAG1 staining was used as a control. Results displayed as the percent change in mean surface fluorescence of conditional knockouts cKO1 (blue) and cKO2 (green) vs. wild type RH strain parasites. Comparisons were made between parasites grown in the absence (closed bars, −Atc) and presence (open bars, +Atc) of 1.5 µg/ml of Atc for 96h prior to analysis. Values represent means ± SD, n = 3, from a representative experiment. * P≤0.05, *** P≤0.001. (B) Immunofluorescence staining of surface MIC2 expression in control (−Atc) merodiploid and cKO1 parasites and following 96h growth in 1.5 µg/ml of Atc (+Atc). Extracellular parasites were stimulated to secrete micronemes by treatment with calcium ionophore (0.2 µM A23187) for 15 min prior to fixation. Surface MIC2 was detected using mAb 6D10 (MαMIC2) followed by goat anti-mouse IgG Alexa 488 (green). After saponin permeablization, parasites were stained with rabbit anti-MIC2 (RαMIC2) followed by goat anti-rabbit IgG Alexa 594 (red). Parasite nuclei were visualized with DAPI (blue). Arrows denote apical end. Scale bar = 5 µm.
Figure 7
Figure 7. Shedding of MIC2 into the supernatant is decreased in the TgROM4 conditional knockout.
Comparison of the shedding of MIC2 into the supernatant following stimulation of secretion in the merodiploid and the cKO2 clone. (A) MIC2 shed into the supernatant (cleaved) vs. that found in intact cells (uncleaved MIC2) was detected using mouse anti-MIC2 Ab (6D10). Shedding was induced by addition of 3%FBS or 3%FBS/2% ethanol. Input standards (diluted 1∶3, 1∶6 and 1∶12 based on the total numbers of cell used in the assay) were used to visualize the total MIC2 levels in unstimulated parasites. Actin, used as a control for inadvertent lysis and as a loading control, was visualized with rabbit anti-TgActin antiserum. Cells were grown in the presence (+Atc) or absence (−Atc) of 1.5 µg/ml Atc for 96 h prior to induction of secretion. (B) MIC2 shedding was quantified from the Western blot and displayed as % secretion compared to the total cellular MIC2 from the input standards. Data from a representative experiment is shown.
Figure 8
Figure 8. Model for the role of TgROM4 in parasite invasion.
TgROM4 is required to maintain an apical to posterior gradient of adhesins such as MIC2. Wild type parasites maintain a gradient of adhesins, undergo normal helical gliding, and readily invade host cells (top). TgROM4 cKO parasites show increased surface levels of adhesins, exhibit twirling movement, and bind laterally to host cells, hence impairing their ability to invade host cells (bottom).

Similar articles

Cited by

References

    1. Sibley LD. Invasion strategies of intracellular parasites. Science. 2004;304:248–253. - PubMed
    1. Dobrowolski JM, Sibley LD. Toxoplasma invasion of mammalian cells is powered by the actin cytoskeleton of the parasite. Cell. 1996;84:933–939. - PubMed
    1. Sahoo N, Beatty WL, Heuser JE, Sept D, Sibley LD. Unusual kinetic and structural properties control rapid assembly and turnover of actin in the parasite Toxoplasma gondii. Mol Biol Cell. 2006;17:895–906. - PMC - PubMed
    1. Gaskins E, Gilk S, DeVore N, Mann T, Ward GE, et al. Identification of the membrane receptor of a class XIV myosin Toxoplasma gondii. J Cell Biol. 2004;165:383–393. - PMC - PubMed
    1. Meissner M, Schluter D, Soldati D. Role of Toxoplasma gondii myosin A in powering parasite gliding and host cell invasion. Science. 2002;298:837–840. - PubMed

Publication types

LinkOut - more resources