Excess direct medical costs of severe obesity by socioeconomic status in German adults
- PMID: 20421952
- PMCID: PMC2858876
- DOI: 10.3205/psm000063
Excess direct medical costs of severe obesity by socioeconomic status in German adults
Abstract
Objective: Excess direct medical costs of severe obesity are by far higher than of moderate obesity. At the same time, severely obese adults with low socioeconomic status (SES) may be expected to have higher excess costs than those with higher SES, e.g. due to more comorbidities. This study compares excess costs of severe obesity among German adults across different SES groups.
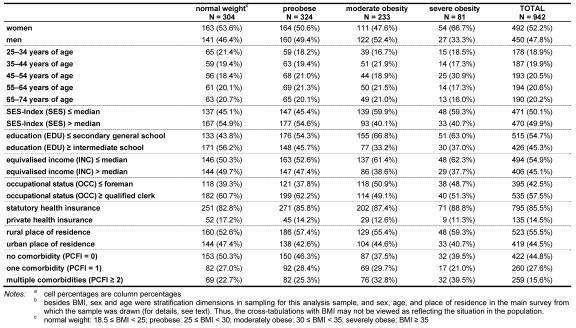
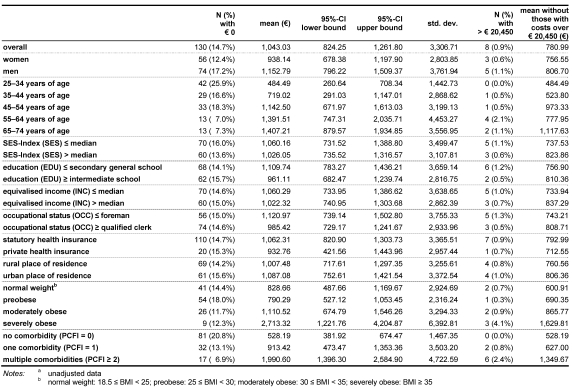
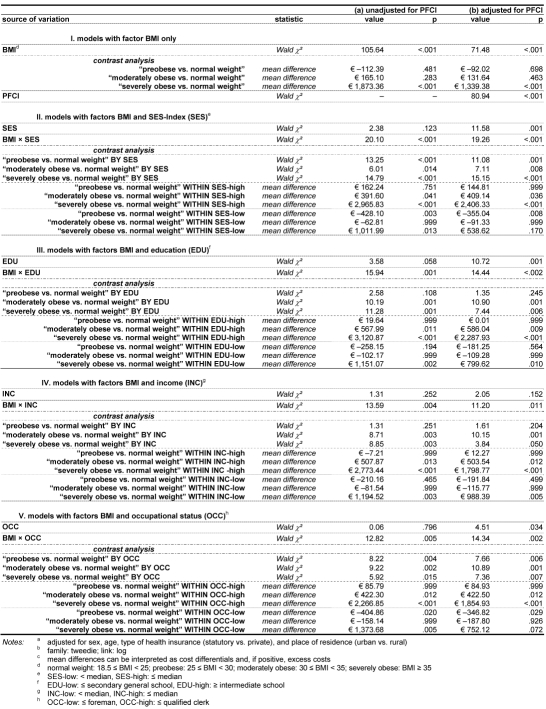
Methods: In a subsample (N=947) of the KORA-Survey S4 1999/2001 (a cross-sectional health survey in the Augsburg region, Germany; age group: 25-74 years), visits to physicians, inpatient days in hospital, and received and purchased medication were assessed via computer-assisted telephone interviews (CATI) over half a year. Body mass index (BMI in kg/m(2)) was measured anthropometrically. SES was determined via reports of education, income, and occupational status from computer-assisted personal interviews (CAPI) (used both as single indicators, and as indexed by the Helmert algorithm); due to small subsample sizes all were median-split. Data of respondents in normal weight (18.5 </= BMI < 25), preobese (25 </= BMI < 30), moderately (class 1:30 </= BMI < 35) and severely obese (classes 2-3: BMI >/= 35) range were analysed by generalized linear models with mixed poisson-gamma (Tweedie) distributions. Physician visits and inpatient days were valuated as recommended by the Working Group METHODS in Health Economic Evaluation (AG MEG), and drugs were valuated by actual costs. Sex, age, kind of sickness fund (statutory/private) and place of residence (urban/rural) were adjusted for, and comorbidities were considered by the Physical Functional Comorbidity Index (PFCI).
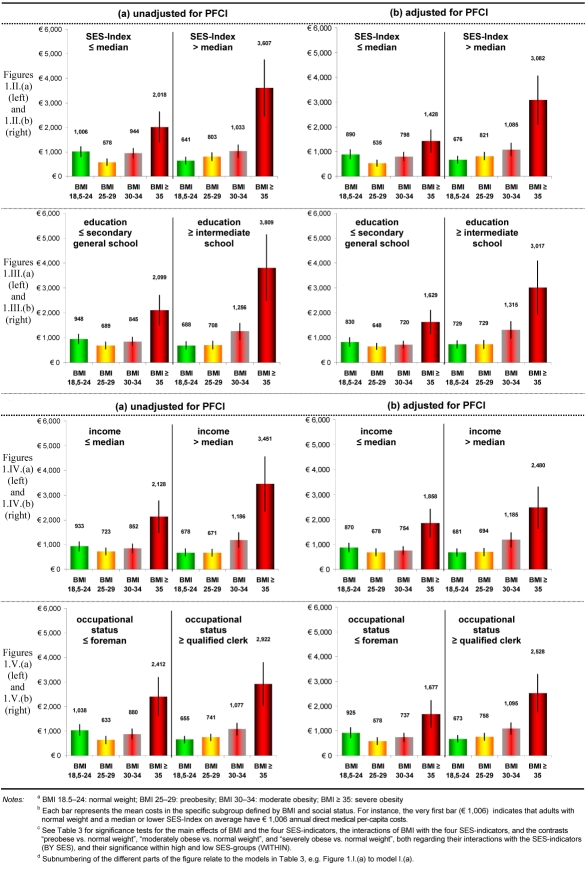
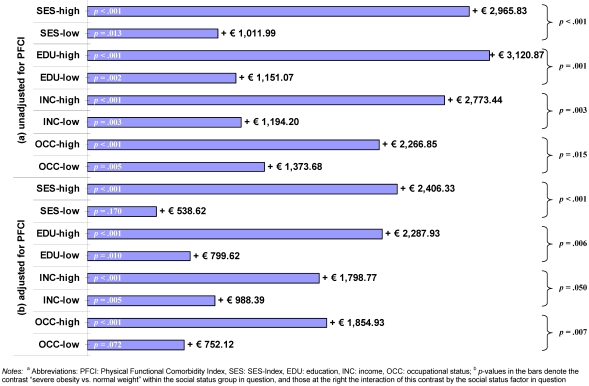
Results: Excess costs of severe obesity were higher in respondents with high SES, regardless of the SES indicator used. For instance, annual excess costs were almost three times higher in those with an above-median SES-Index as compared with those with a median or lower SES-Index (plus euro 2,966 vs. plus euro 1,012; contrast significant at p<.001). Mediation of excess costs of severe obesity by physical comorbidities pertained to the low SES-Index and the low occupational status groups: differences in costs between severe obesity and normal weight were still positive, but statistically insignificant, in the lower status groups after adjusting for the PFCI, but still positive and significant given higher SES. For example, severe obesity's excess costs were euro 2,406 after PFCI-adjustment in the high SES-Index group (p<.001), but euro 539 in the lower status group (p=.17). At the same time, physical comorbidities as defined by the PCFI increased with BMI and decreased with SES, however the factors BMI and SES did not significantly interact in this context.
Conclusions: To our knowledge, this is the first study to show in Germany that excess direct medical costs of severe obesity are not distributed equitably across different SES groups, do not reflect comorbidity status, and are significantly higher in those with high SES than in those with lower SES. Thus, allocation of health care resources spent on severely obese adults seems to be in need of readjustment towards an equitable utilization across all socioeconomic groups.
Zielsetzung: Die direkten medizinischen Exzesskosten der schweren Adipositas sind deutlich höher als die der moderaten Adipositas. Zugleich ist zu erwarten, dass (schwer) adipöse Erwachsene mit niedrigem sozio-ökonomischen Status (SES) höhere Exzesskosten aufweisen als solche mit höherem SES, z. B. aufgrund höherer Komorbiditäten. Diese Studie vergleicht die Exzesskosten der (schweren) Adipositas bei Erwachsenen in verschiedenen SES-Gruppen.
Methodik: In einer Teilstichprobe (N=947) des KORA-Survey S4 1999/2001 (ein querschnittlicher Gesundheitssurvey in der Region Augsburg; Altersgruppe: 25–74 Jahre) wurden Arztkontakte, Medikamentenkäufe und -erhalte sowie stationäre Krankenhaustage über ein halbes Jahr via computergestützte telefonische Interviews (CATI) erhoben. Der Body Mass Index (BMI in kg/m²) wurde anthropometrisch gemessen. Der SES wurde durch Angaben zu Bildung, Einkommen und Berufstatus aus computergestützten persönlichen Interviews (CAPI) bestimmt (sie gingen sowohl als Einzelindikatoren als auch als Helmert-Index in die Analysen ein); alle wurden wegen geringer Teilstichprobengrößen medianhalbiert. Die Daten von Teilnehmern mit Normalgewicht (18,5 ≤ BMI < 25), Präadipositas (25 ≤ BMI < 30), moderater (Grad 1:30 ≤ BMI < 35) und schwerer Adipositas (Grade 2–3: BMI ≥ 35) wurden mittels allgemeiner linearer Modelle mit gemischten Poission-Gamma- (Tweedie-) Verteilungen analysiert. Arztkontakte und Krankenhaustage wurden gemäß dem Vorschlag der Arbeitsgruppe Methoden der gesundheitsökonomischen Evaluation (AG MEG) bewertet, und Medikamente mit den tatsächlichen Kosten. Für Geschlecht, Alter, Krankenkasse (GKV/PKV) und Wohnort (Stadt/Land) wurde adjustiert, und Komorbiditäten mittels des Physical Functional Comorbidity Index (PFCI) berücksichtigt.
Ergebnisse: Die Exzesskosten der schweren Adipositas waren in Gruppen mit hohem SES höher, unabhängig vom verwendeten SES-Indikator. So waren diese jährlichen Exzesskosten in der Gruppe mit einem SES-Indexwert überhalb des Medians um den Faktor drei gegenüber der Gruppe mit einem medianen oder kleineren SES-Indexwert erhöht (plus € 2.966 vs. plus € 1.012; signifikanter Kontrast: p<.001). Die Vermittlung der Exzesskosten der schweren Adipositas durch körperliche Komorbiditäten beschränkte sich auf niedrigen SES-Index und Berufsstatus. Dabei waren die Kostendifferenziale zwischen schwerer Adipositas und Normalgewicht nach Adjustierung für den PFCI bei niedrigem SES zwar weiterhin positiv aber statistisch nicht mehr signifikant, hingegen waren sie bei höherem SES weiterhin positiv und signifikant. Hier betrugen die Exzesskosten der schweren Adipositas € 2.406 in der hohen SES-Indexgruppe (p<.001), jedoch € 539 in der unteren Statusgruppe (p=.17). Gleichzeitig waren körperliche Komorbiditäten im Sinne des PFCI positiv mit dem BMI und negativ mit dem SES assoziiert, wobei die Faktoren BMI und SES allerdings nicht signifikant interagierten.
Fazit: Die vorliegende Studie ist unseres Wissens die erste, die in Deutschland zeigt, dass die Exzesskosten der schweren Adipositas über unterschiedlichen SES-Gruppen ungleich verteilt sind, nicht den Komorbiditätsstatus reflektieren, und in hohen SES-Gruppen signifikant höher ausfallen als in niedrigeren SES-Gruppen. Es besteht offenbar Bedarf an einer besseren Allokation der Ressourcen gesundheitsbezogener Versorgung, die für (schwer) adipöse Erwachsene ausgegeben werden, in Richtung auf eine bedarfsgerechtere Inanspruchnahme über alle sozio-ökonomischen Gruppen hinweg.
Keywords: Germany; comorbidities; health care costs; obesity; socioeconomic status.
Figures
Similar articles
-
Body weight dissatisfaction by socioeconomic status among obese, preobese and normal weight women and men: results of the cross-sectional KORA Augsburg S4 population survey.BMC Public Health. 2012 May 9;12:342. doi: 10.1186/1471-2458-12-342. BMC Public Health. 2012. PMID: 22571239 Free PMC article.
-
[Direct medical costs of (severe) obesity: a bottom-up assessment of over- vs. normal-weight adults in the KORA-study region (Augsburg, Germany)].Gesundheitswesen. 2006 Feb;68(2):110-5. doi: 10.1055/s-2005-858994. Gesundheitswesen. 2006. PMID: 16482491 German.
-
Utilization of out- and inpatient health services by obese adults: a population-based study in the Augsburg region, Germany.Gesundheitswesen. 2005 Aug;67 Suppl 1:S150-7. doi: 10.1055/s-2005-858510. Gesundheitswesen. 2005. PMID: 16032534 Clinical Trial.
-
Economic costs of adult obesity: a review of recent European studies with a focus on subgroup-specific costs.Maturitas. 2011 Jul;69(3):220-9. doi: 10.1016/j.maturitas.2011.04.005. Epub 2011 May 18. Maturitas. 2011. PMID: 21592692 Review.
-
Impact of socioeconomic status on end-of-life costs: a systematic review and meta-analysis.BMC Palliat Care. 2020 Mar 23;19(1):35. doi: 10.1186/s12904-020-0538-y. BMC Palliat Care. 2020. PMID: 32293403 Free PMC article.
Cited by
-
Changes in body weight and obesity status in German adults: results of seven population-based prospective studies.Eur J Clin Nutr. 2016 Mar;70(3):300-5. doi: 10.1038/ejcn.2015.179. Epub 2015 Oct 28. Eur J Clin Nutr. 2016. PMID: 26508458
-
Body weight dissatisfaction by socioeconomic status among obese, preobese and normal weight women and men: results of the cross-sectional KORA Augsburg S4 population survey.BMC Public Health. 2012 May 9;12:342. doi: 10.1186/1471-2458-12-342. BMC Public Health. 2012. PMID: 22571239 Free PMC article.
-
Socioeconomic Inequalities in the Rise of Adult Obesity: A Time-Trend Analysis of National Examination Data from Germany, 1990-2011.Obes Facts. 2019;12(3):344-356. doi: 10.1159/000499718. Epub 2019 Jun 5. Obes Facts. 2019. PMID: 31167203 Free PMC article.
-
Obesity and healthcare resource utilization: results from Clinical Practice Research Database (CPRD).Obes Sci Pract. 2018 Aug 21;4(5):409-416. doi: 10.1002/osp4.291. eCollection 2018 Oct. Obes Sci Pract. 2018. PMID: 30338111 Free PMC article.
-
Scalable office-based health care.Health Serv Manage Res. 2011 May;24(2):69-74. doi: 10.1258/hsmr.2010.010015. Health Serv Manage Res. 2011. PMID: 21471576 Free PMC article.
References
-
- Allender S, Rayner M. The burden of overweight and obesity-related ill health in the UK. Obes Rev. 2007;8(5):467–473. doi: 10.1111/j.1467-789X.2007.00394.x. Available from: http://dx.doi.org/10.1111/j.1467-789X.2007.00394.x. - DOI - DOI - PubMed
-
- Finkelstein EA, Ruhm CJ, Kosa KM. Economic causes and consequences of obesity. Annu Rev Public Health. 2005;26:239–257. doi: 10.1146/annurev.publhealth.26.021304.144628. Available from: http://dx.doi.org/10.1146/annurev.publhealth.26.021304.144628. - DOI - DOI - PubMed
-
- Gavard JA. Health care costs of obesity in women. Obstet Gynecol Clin North Am. 2009;36(2):213–26, xii. doi: 10.1016/j.ogc.2009.04.002. Available from: http://dx.doi.org/10.1016/j.ogc.2009.04.002. - DOI - DOI - PubMed
-
- Müller-Riemenschneider F, Reinhold T, Berghöfer A, Willich SN. Health-economic burden of obesity in Europe. Eur J Epidemiol. 2008;23(8):499–509. doi: 10.1007/s10654-008-9239-1. Available from: http://dx.doi.org/10.1007/s10654-008-9239-1. - DOI - DOI - PubMed
-
- Witkos M, Uttaburanont M, Lang CD, Arora R. Costs of and reasons for obesity. J Cardiometab Syndr. 2008;3(3):173–176. doi: 10.1111/j.1559-4572.2008.00012.x. Available from: http://dx.doi.org/10.1111/j.1559-4572.2008.00012.x. - DOI - DOI - PubMed
LinkOut - more resources
Full Text Sources