

EEG responses to TMS are sensitive to changes in the perturbation parameters and repeatable over time
- PMID: 20421968
- PMCID: PMC2858649
- DOI: 10.1371/journal.pone.0010281
EEG responses to TMS are sensitive to changes in the perturbation parameters and repeatable over time
Abstract
Background: High-density electroencephalography (hd-EEG) combined with transcranial magnetic stimulation (TMS) provides a direct and non-invasive measure of cortical excitability and connectivity in humans and may be employed to track over time pathological alterations, plastic changes and therapy-induced modifications in cortical circuits. However, the diagnostic/monitoring applications of this technique would be limited to the extent that TMS-evoked potentials are either stereotypical (non-sensitive) or random (non-repeatable) responses. Here, we used controlled changes in the stimulation parameters (site, intensity, and angle of stimulation) and repeated longitudinal measurements (same day and one week apart) to evaluate the sensitivity and repeatability of TMS/hd-EEG potentials.
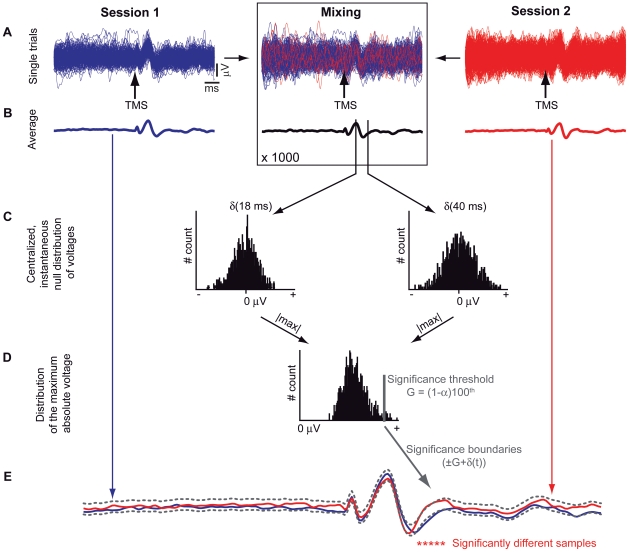
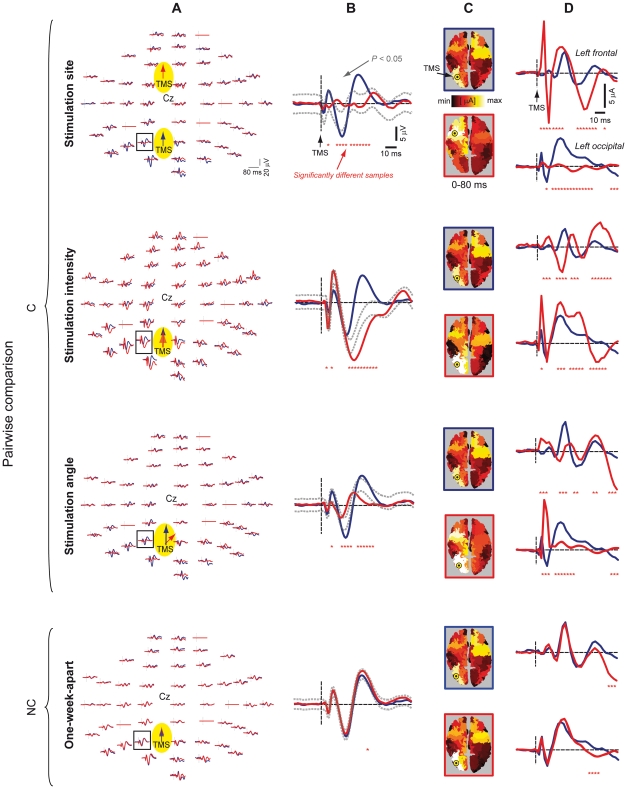
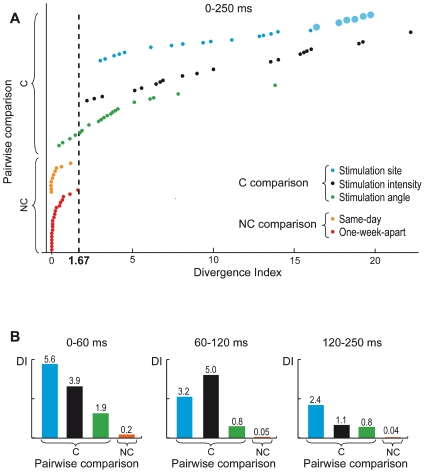
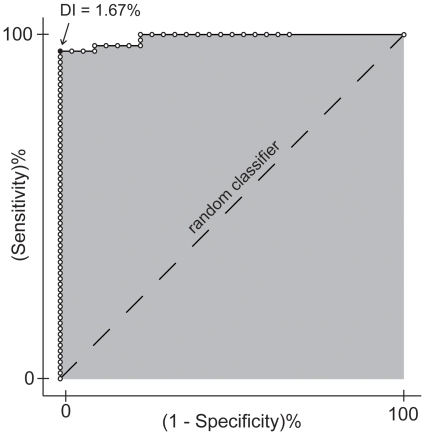
Methodology/principal findings: In 10 volunteers, we performed 92 single-subject comparisons to evaluate the similarities/differences between pairs of TMS-evoked potentials recorded in the same/different stimulation conditions. For each pairwise comparison, we used non-parametric statistics to calculate a Divergence Index (DI), i.e., the percentage of samples that differed significantly, considering all scalp locations and the entire post-stimulus period. A receiver operating characteristic analysis showed that it was possible to find an optimal DI threshold of 1.67%, yielding 96.7% overall accuracy of TMS/hd-EEG in detecting whether a change in the perturbation parameters occurred or not.
Conclusions/significance: These results demonstrate that the EEG responses to TMS essentially reflect deterministic properties of the stimulated neuronal circuits as opposed to stereotypical responses or uncontrolled variability. To the extent that TMS-evoked potentials are sensitive to changes and repeatable over time, they may be employed to detect longitudinal changes in the state of cortical circuits.
Conflict of interest statement
Figures
References
-
- Virtanen J, Ruohonen J, Näätänen R, Ilmoniemi RJ. Instrumentation for the measurement of electric brain responses to transcranial magnetic stimulation. Med Biol Eng Comput. 1999;37:322–326. - PubMed
-
- Thut G, Ives JR, Kampmann F, Pastor MA, Pascual-Leone A. A new device and protocol for combining TMS and online recordings of EEG and evoked potentials. J Neurosci Methods. 2005;141:207–217. - PubMed
-
- Ilmoniemi RJ, Ruohonen J, Karhu J. Transcranial magnetic stimulation–a new tool for functional imaging of the brain. Crit Rev Biomed Eng. 1999;27:241–284. - PubMed
-
- Ilmoniemi RJ, Virtanen J, Ruohonen J, Karhu J, Aronen HJ, et al. Neuronal responses to magnetic stimulation reveal cortical reactivity and connectivity. Neuroreport. 1997;8:3537–3540. - PubMed
Publication types
MeSH terms
LinkOut - more resources
Full Text Sources
Other Literature Sources
Medical
