

Repeated stimulus exposure alters the way sound is encoded in the human brain
- PMID: 20421969
- PMCID: PMC2858650
- DOI: 10.1371/journal.pone.0010283
Repeated stimulus exposure alters the way sound is encoded in the human brain
Abstract
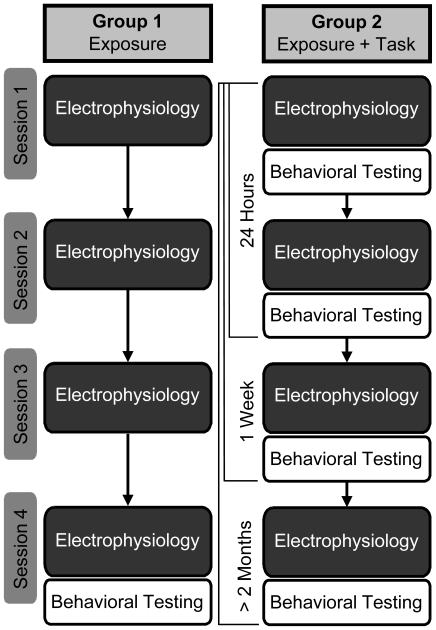
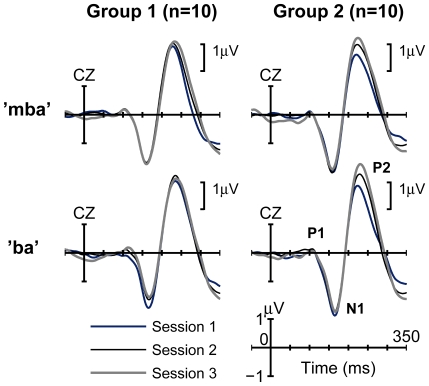
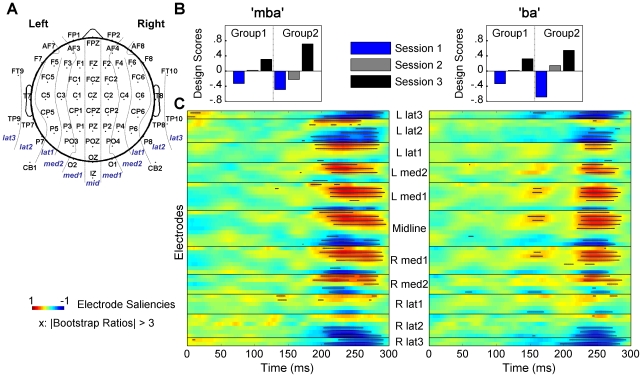
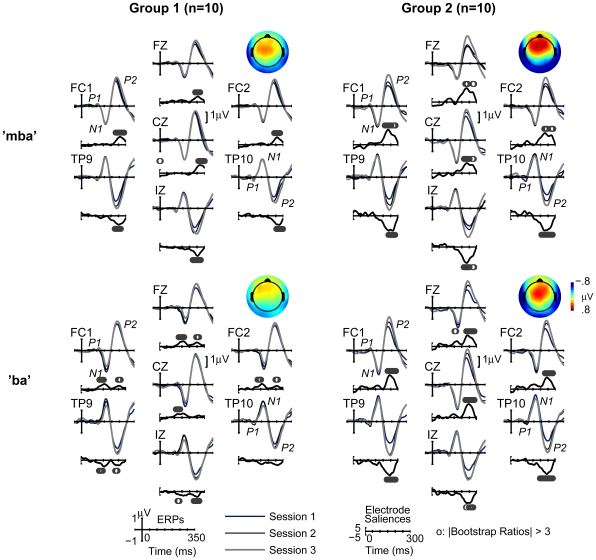
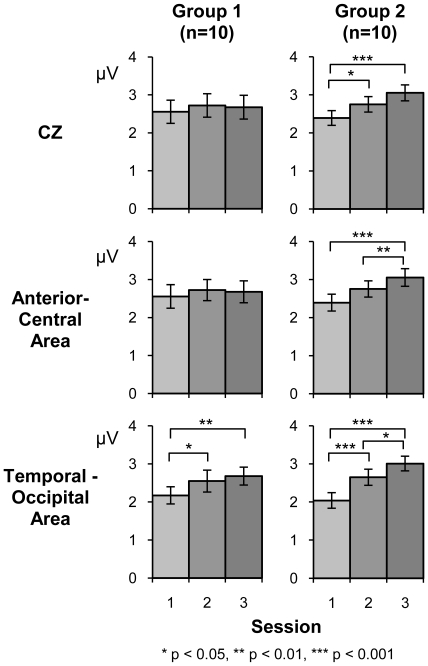
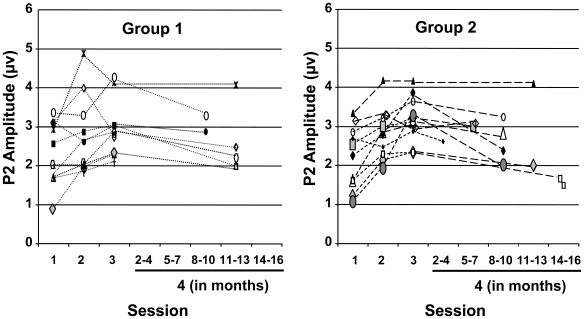
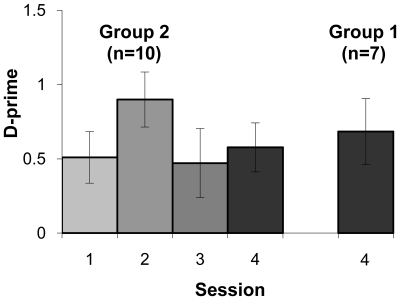
Auditory training programs are being developed to remediate various types of communication disorders. Biological changes have been shown to coincide with improved perception following auditory training so there is interest in determining if these changes represent biologic markers of auditory learning. Here we examine the role of stimulus exposure and listening tasks, in the absence of training, on the modulation of evoked brain activity. Twenty adults were divided into two groups and exposed to two similar sounding speech syllables during four electrophysiological recording sessions (24 hours, one week, and up to one year later). In between each session, members of one group were asked to identify each stimulus. Both groups showed enhanced neural activity from session-to-session, in the same P2 latency range previously identified as being responsive to auditory training. The enhancement effect was most pronounced over temporal-occipital scalp regions and largest for the group who participated in the identification task. The effects were rapid and long-lasting with enhanced synchronous activity persisting months after the last auditory experience. Physiological changes did not coincide with perceptual changes so results are interpreted to mean stimulus exposure, with and without being paired with an identification task, alters the way sound is processed in the brain. The cumulative effect likely involves auditory memory; however, in the absence of training, the observed physiological changes are insufficient to result in changes in learned behavior.
Conflict of interest statement
Figures
Similar articles
-
Changes in sensory evoked responses coincide with rapid improvement in speech identification performance.J Cogn Neurosci. 2010 Feb;22(2):392-403. doi: 10.1162/jocn.2009.21279. J Cogn Neurosci. 2010. PMID: 19485700
-
Preattentive cortical-evoked responses to pure tones, harmonic tones, and speech: influence of music training.Ear Hear. 2009 Aug;30(4):432-46. doi: 10.1097/AUD.0b013e3181a61bf2. Ear Hear. 2009. PMID: 19494778
-
Plasticity in neuromagnetic cortical responses suggests enhanced auditory object representation.BMC Neurosci. 2013 Dec 5;14:151. doi: 10.1186/1471-2202-14-151. BMC Neurosci. 2013. PMID: 24314010 Free PMC article.
-
Sound-Making Actions Lead to Immediate Plastic Changes of Neuromagnetic Evoked Responses and Induced β-Band Oscillations during Perception.J Neurosci. 2017 Jun 14;37(24):5948-5959. doi: 10.1523/JNEUROSCI.3613-16.2017. Epub 2017 May 24. J Neurosci. 2017. PMID: 28539421 Free PMC article.
-
Explaining the high voice superiority effect in polyphonic music: evidence from cortical evoked potentials and peripheral auditory models.Hear Res. 2014 Feb;308:60-70. doi: 10.1016/j.heares.2013.07.014. Epub 2013 Aug 3. Hear Res. 2014. PMID: 23916754 Review.
Cited by
-
Auditory sensitivity exhibits sexual dimorphism and seasonal plasticity in music frogs.J Comp Physiol A Neuroethol Sens Neural Behav Physiol. 2018 Dec;204(12):1029-1044. doi: 10.1007/s00359-018-1301-1. Epub 2018 Oct 30. J Comp Physiol A Neuroethol Sens Neural Behav Physiol. 2018. PMID: 30377768
-
Auditory perception exhibits sexual dimorphism and left telencephalic dominance in Xenopus laevis.Biol Open. 2018 Dec 3;7(12):bio035956. doi: 10.1242/bio.035956. Biol Open. 2018. PMID: 30509903 Free PMC article.
-
Neural activities in music frogs reveal call variations and phylogenetic relationships within the genus Nidirana.Commun Biol. 2022 Jun 6;5(1):550. doi: 10.1038/s42003-022-03504-8. Commun Biol. 2022. PMID: 35668095 Free PMC article.
-
Top-down or bottom up: decreased stimulus salience increases responses to predictable stimuli of auditory thalamic neurons.J Physiol. 2019 May;597(10):2767-2784. doi: 10.1113/JP277450. Epub 2019 Apr 21. J Physiol. 2019. PMID: 30924931 Free PMC article.
-
Hearing AIDS and the brain.Int J Otolaryngol. 2014;2014:518967. doi: 10.1155/2014/518967. Epub 2014 Sep 3. Int J Otolaryngol. 2014. PMID: 25276137 Free PMC article. No abstract available.
References
-
- Kuhl PK. Is speech learning “gated” by the social brain? Dev Sci. 2007;10:110–120. - PubMed
-
- Tremblay K. Training-related changes in the brain: evidence from human auditory-evoked potentials. Seminars in Hearing. 2007;28:120–132.
-
- Moucha R, Kilgard MP. Cortical plasticity and rehabilitation. In: Moller A, editor. Reprogramming the brain: Progress in brain research. Dallas: Elsevier; 2006. pp. 111–122. - PubMed
-
- Dahmen JC, King AJ. Learning to hear: plasticity of auditory cortical processing. Curr Opin Neurobiol. 2007;17:456–464. - PubMed
-
- Brattico E, Tervaniemi M, Picton TW. Effects of brief discrimination-training on the auditory N1 wave. Neuroreport. 2003;14:2489–2492. - PubMed
Publication types
MeSH terms
Grants and funding
LinkOut - more resources
Full Text Sources
Medical
