. 2010 Apr 22;5(4):e10282.
doi: 10.1371/journal.pone.0010282.

Permanent occlusion of feeding arteries and draining veins in solid mouse tumors by vascular targeted photodynamic therapy (VTP) with Tookad

Affiliations

Permanent occlusion of feeding arteries and draining veins in solid mouse tumors by vascular targeted photodynamic therapy (VTP) with Tookad

Noa Madar-Balakirski et al. PLoS One. .

Abstract

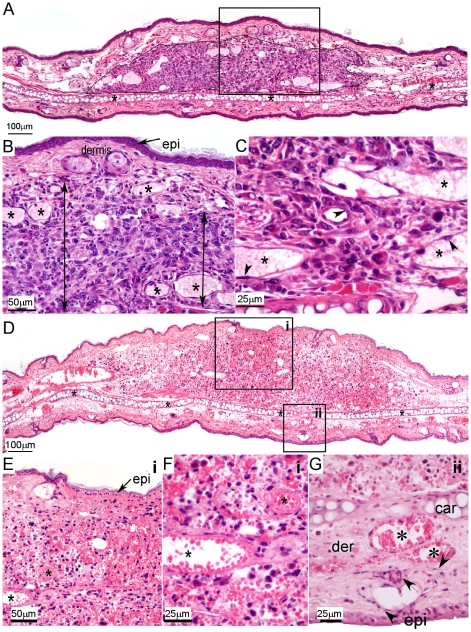
Background: Antiangiogenic and anti-vascular therapies present intriguing alternatives to cancer therapy. However, despite promising preclinical results and significant delays in tumor progression, none have demonstrated long-term curative features to date. Here, we show that a single treatment session of Tookad-based vascular targeted photodynamic therapy (VTP) promotes permanent arrest of tumor blood supply by rapid occlusion of the tumor feeding arteries (FA) and draining veins (DV), leading to tumor necrosis and eradication within 24-48 h.

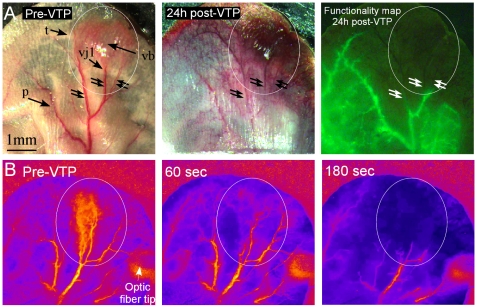
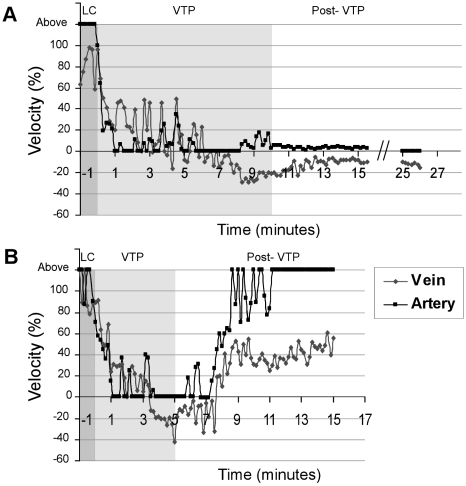
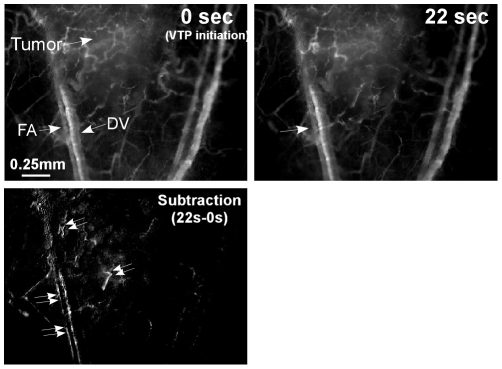
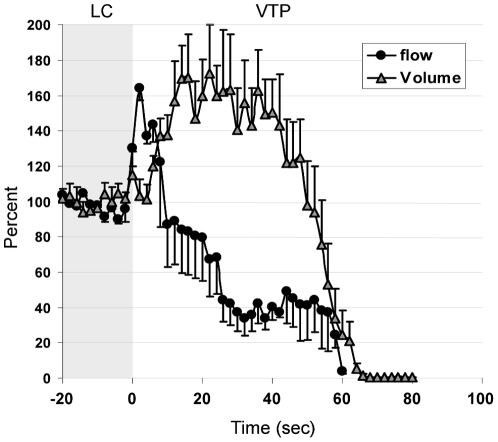
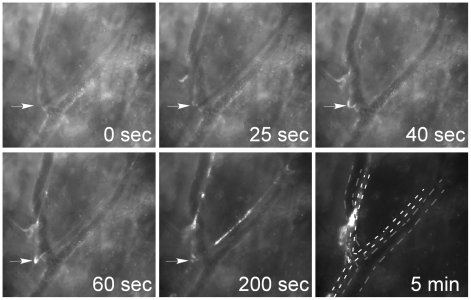
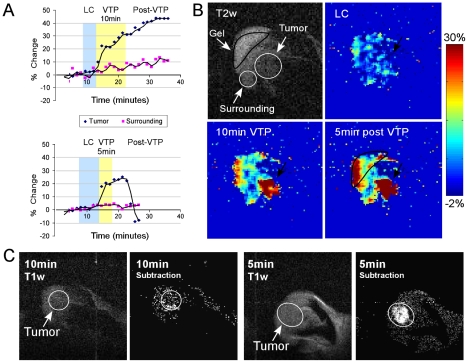
Methodology/principal findings: A mouse earlobe MADB106 tumor model was subjected to Tookad-VTP and monitored by three complementary, non-invasive online imaging techniques: Fluorescent intravital microscopy, Dynamic Light Scattering Imaging and photosensitized MRI. Tookad-VTP led to prompt tumor FA vasodilatation (a mean volume increase of 70%) with a transient increase (60%) in blood-flow rate. Rapid vasoconstriction, simultaneous blood clotting, vessel permeabilization and a sharp decline in the flow rates then followed, culminating in FA occlusion at 63.2 sec+/-1.5SEM. This blockage was deemed irreversible after 10 minutes of VTP treatment. A decrease in DV blood flow was demonstrated, with a slight lag from FA response, accompanied by frequent changes in flow direction before reaching a complete standstill. In contrast, neighboring, healthy tissue vessels of similar sizes remained intact and functional after Tookad-VTP.

Conclusion/significance: Tookad-VTP selectively targets the tumor feeding and draining vessels. To the best of our knowledge, this is the first mono-therapeutic modality that primarily aims at the larger tumor vessels and leads to high cure rates, both in the preclinical and clinical arenas.


Conflict of interest statement

Competing Interests: Y.S. and A.S. are the inventors of Tookad; patent owned by the Weizmann Institute of Science, Rehovot, Israel, licensed to STEBA biotech, France (Scherz A, Salomon Y, Scheer H, Brandis A (2003) Palladium-substituted bacteriochlorophyll derivatives and use thereof, US patent 6569846, reference #20 in the manuscript). A.S. and Y.S. serve as consultants to STEBA biotech. This does not alter adherence to all the PLoS ONE policies on sharing data and materials.

Figures

Figure 1
Figure 1. Selective occlusion of tumor vasculature following VTP.
A. The tumor (t, marked by an ellipse) containing a discrete vascular bed (vb) is supplied and drained by major FAs and DVs (double arrows). Vascular Junction 1 (vj1) defines the interface between the tumor's small vessels (e.g. capillaries, etc.) and the FAs/DVs. Pre-existing, non-tumor vessels (p) can be seen in the surrounding normal tissue. The same tumor area is depicted in the middle panel 24 h after VTP. The right hand panel is an image captured during angiography follow up at 24 h post-VTP. Selective loss of tumor blood vessel functionality, as seen by exclusion of the fluorescent marker, was apparent, while normal vasculature in the surrounding tissue remained functional. B. Dynamic light scattering imaging of a mouse earlobe before, 60 sec and 180 sec after Tookad-VTP initiation demonstrated selective reduction in tumor perfusion. Towards the end of the treatment (180 sec), no perfusion was detected in the tumor zone, while the surrounding vasculature remained functional until treatment completion. Images were produced by temporal contrast calculations and are presented as color-scale coded maps (higher perfusion is illustrated as lighter colors). These images are clips selected from Video S1. A and B are represented by two individual animals. All other details are described in the Materials and Methods section.
Figure 2
Figure 2. Histopathology of the Tookad-VTP-treated tumor-bearing earlobe.
Hematoxilin-Eosin staining of untreated MADB106 tumor-bearing ear sections (A–C) compared to Tookad-VTP-treated tumors 24 h post treatment (D–G) are shown. A. (magnification: ×10) The untreated tissue included viable neoplastic cells which formed a small and well-demarcated mass (outlined in black) within the dermis of the pinna. The aural cartilage is identified by asterisks. The boxed area is further magnified in B (x20) and includes the epidermis (epi), dermis, and the lumen of several vascular spaces (asterisks). At higher magnifications (C, ×40) several blood vessels surrounded by neoplastic cells were identified (lumen identified with asterisks), where the endothelial cells lining them (arrowheads) were shown to be viable. D. (magnification: ×10) 24 h following Tookad-VTP, necrosis, hemorrhage, edema and vascular congestion in the tumor area were apparent (boxed in i), with only a small degree of similar findings in the surrounding tissues (boxed in ii). E. Magnified (x20) tumor area of (Di) showed diffuse necrosis and hemorrhage, no identifiable viable neoplastic cells and a necrotic epidermal layer (epi) above the tumor. The lumen of blood vessels is marked (asterisks). F. Further magnification (x40) showed the diffuse necrosis which affected all cells and included extravasated red blood cells indicating acute hemorrhage. Two blood vessels were identified (asterisks) but no viable endothelial cells were seen. G. Magnified (x40) surrounding tissues of (Dii) showed necrotic neoplastic tissue located above the aural cartilage (car). The dermis below the cartilage (der) was mildly edematous and contained dilated dermal blood vessels (asterisks). Epidermal cells (epi) and sebaceous gland cells (arrows) contained viable nuclei.
Figure 3
Figure 3. VTP-induced changes in tumor blood-flow.
Arterial and venous blood flow during the last minute of light control (LC, dark-gray background), through the full 10 min VTP protocol (A, light-gray background, n = 3, representative mouse is shown) or partial, 5 min treatment protocol (B, light-gray background, n = 3, representative mouse is shown) were monitored. Time resolution = 10 sec. Baseline (100%) was defined by the average blood flow value during the 5 min LC subsession. A sharp decline in the FA flow rate, followed by its collapse after ∼1 min VTP, was accompanied with random pauses and reversed venous blood flow (represented as negative flow values). The standard VTP protocol induced irreversible arterial blood flow arrest, with a concomitant reversal in venous blood flow direction (A), observed to persist until the end of data acquisition. Early termination (light off at 5 min) led to the rehabilitation of blood flow levels (B).
Figure 4
Figure 4. Tookad-VTP induced changes in blood vessel diameter and morphology.
Angiography images of the illuminated area, extracted from Video S4 before treatment and at tVTP = 22 sec are presented. Subtraction of the latter from the former is shown in the lower image. Arrows indicate FAs/DVs. An increase in the vascular-associated fluorescence (indicated by double-arrows), peaking at 22 seconds from the onset of illumination was observed within the tumor boundaries, but not in the arteries that perfused the surrounding normal tissue.
Figure 5
Figure 5. Tookad-VTP induced increase in arterial blood flow rate and volume.
Arterial blood flow rates and volumes were monitored in the tumor FA during VTP. Baseline (100%) was defined by the average of LC recordings (gray background). Data analyzed at a 2 sec time resolution is presented as the mean ± SEM (n = 5). A prompt, but transient ≤60% increase in arterial blood flow velocity, followed by an up to 70% elevation in FA blood volume was observed upon initiation of VTP. Approximately twenty seconds later, a gradual decline in the arterial blood volume and flow rate was observed to the point of complete vascular collapse, whereby stasis was observed at tVTP≅60 seconds.
Figure 6
Figure 6. Tookad-VTP induced blood clotting.
Circulating leukocytes and platelets were stained in vivo with Rhodamine6G immediately before sensitizer injection and were monitored online throughout the full VTP protocol (images taken from Video S5). Blood clot formation began on the inner vessel wall within 25 sec of VTP initiation, particularly at the vessel bifurcation points, and was concomitant with vessel constriction. Five minutes after VTP onset, a newly formed blood clot occluded the FA, and significantly obstructed tumor arterial blood supply. White and gray dashed lines define arterial and venous boundaries respectively.
Figure 7
Figure 7. VTP-induced changes as seen via BOLD contrast.
A. Graphic presentations of percent changes in BOLD contrast before treatment, during LC (blue background), 10 min-VTP or 5 min–VTP (yellow background – upper and lower graphs, respectively) and after VTP are shown. Increases in BOLD contrast signals upon VTP remained constant when illumination continued for 10 min, but declined to pretreated values when illumination was terminated at 5 min. B. T2w image of the ear tumor, normal surrounding tissues and gel is presented. BOLD activation maps of LC, 10 min VTP and 5 min post-VTP are presented (images taken from Video S6). C. Spin-echo T1w images following 10 min or 5 min-VTP are shown. Gd-DTPA was administered ∼20 min post-VTP. The T1w post-injection images were subtracted from the pre-injection images and the difference are shown (2nd and 4th panels). Exclusion of Gd-DTPA following standard 10 min VTP confirmed tumor-blood stasis, while perfusion of Gd-DTPA following the partial 5 min illumination indicated blood-flow rehabilitation.

Similar articles

Cited by

References

    1. Folkman J. Tumor angiogenesis: therapeutic implications. N Engl J Med. 1971;285:1182–1186. - PubMed
    1. Jain RK. Normalization of tumor vasculature: an emerging concept in antiangiogenic therapy. Science. 2005;307:58–62. - PubMed
    1. Dvorak HF. Angiogenesis: update 2005. J Thromb Haemost. 2005;3:1835–1842. - PubMed
    1. Cooney MM, van Heeckeren W, Bhakta S, Ortiz J, Remick SC. Drug insight: vascular disrupting agents and angiogenesis–novel approaches for drug delivery. Nat Clin Pract Oncol. 2006;3:682–692. - PubMed
    1. Tozer GM, Ameer-Beg SM, Baker J, Barber PR, Hill SA, et al. Intravital imaging of tumour vascular networks using multi-photon fluorescence microscopy. Adv Drug Deliv Rev. 2005;57:135–152. - PubMed

Publication types

MeSH terms

Substances