

Efficient physical embedding of topologically complex information processing networks in brains and computer circuits
- PMID: 20421990
- PMCID: PMC2858671
- DOI: 10.1371/journal.pcbi.1000748
Efficient physical embedding of topologically complex information processing networks in brains and computer circuits
Abstract
Nervous systems are information processing networks that evolved by natural selection, whereas very large scale integrated (VLSI) computer circuits have evolved by commercially driven technology development. Here we follow historic intuition that all physical information processing systems will share key organizational properties, such as modularity, that generally confer adaptivity of function. It has long been observed that modular VLSI circuits demonstrate an isometric scaling relationship between the number of processing elements and the number of connections, known as Rent's rule, which is related to the dimensionality of the circuit's interconnect topology and its logical capacity. We show that human brain structural networks, and the nervous system of the nematode C. elegans, also obey Rent's rule, and exhibit some degree of hierarchical modularity. We further show that the estimated Rent exponent of human brain networks, derived from MRI data, can explain the allometric scaling relations between gray and white matter volumes across a wide range of mammalian species, again suggesting that these principles of nervous system design are highly conserved. For each of these fractal modular networks, the dimensionality of the interconnect topology was greater than the 2 or 3 Euclidean dimensions of the space in which it was embedded. This relatively high complexity entailed extra cost in physical wiring: although all networks were economically or cost-efficiently wired they did not strictly minimize wiring costs. Artificial and biological information processing systems both may evolve to optimize a trade-off between physical cost and topological complexity, resulting in the emergence of homologous principles of economical, fractal and modular design across many different kinds of nervous and computational networks.
Conflict of interest statement
The authors have declared that no competing interests exist.
Figures
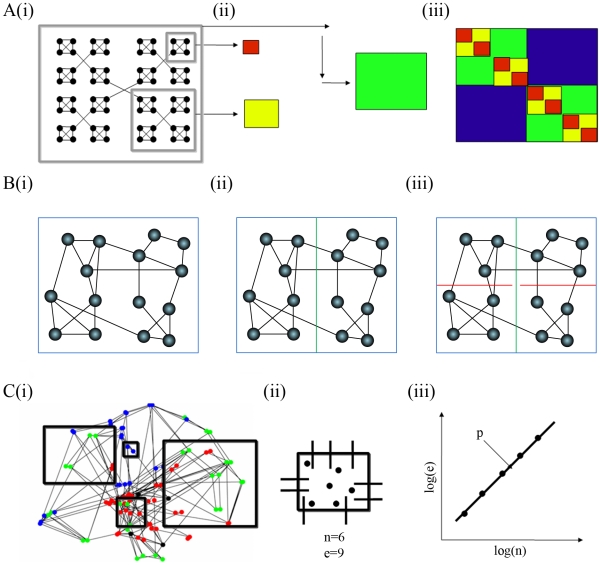
 ), and the number of edges (
 ) crossing the partitions; a linear relationship between these two variables plotted on logarithmic axes indicates topological Rentian scaling of network connectivity and provides an estimator of the topological dimension
  of the network, . To estimate the physical Rent exponent, we randomly place 5000 randomly sized boxes on the physically embedded network, e.g., the human brain network in anatomical space C(i). Then we count the number of nodes
  and the number of boundary-crossing edges
  for each box C(ii) and estimate the physical Rent exponent
  by the linear relationship between these two variables on logarithmic axes, C(iii).
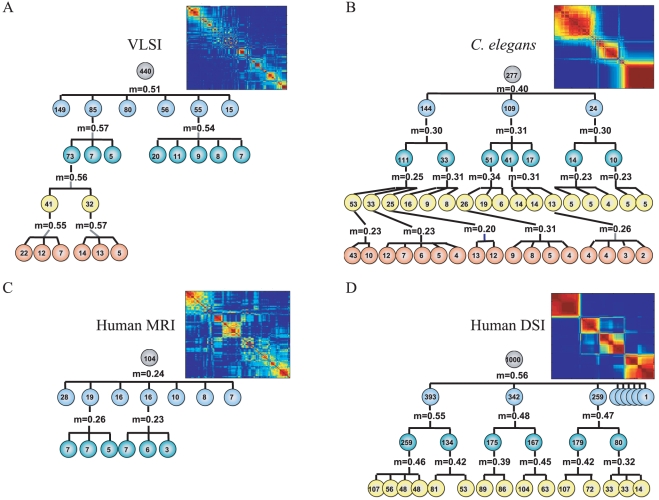
 , of each of these matrices was estimated using the Louvain community detection algorithm ; 1-tailed t-tests were performed to determine where the modularity of the observed network was higher than the modularity of a functional random (p-value,
  ), and pure random (p-value,
  ) network. The matrices were decomposed into their sub-modules, and each sub-module was tested for modularity,
  , greater than functional and pure random networks (
 ,
,  ) of the same size as the module being tested. This process was iteratively performed: sub-modules were tested for non-random modularity, and if sub-sub-modules were identified in this way then each of them was in turn tested for non-random modularity. All modules shown in the decomposition had
  ,
,  except for those few indicated in gray (
 ) and blue (
 ). Complete decompositions are shown for the VLSI and human brain MRI network; both the C. elegans and human brain DSI networks continue to deeper hierarchical levels, here not shown due to space constraints (see supplementary Text S1 for full decompositions). Insets The inset panels give a visual depiction of the hierarchical modularity of each system, which has been represented by a co-classification matrix where red/brown colors highlight modules or clusters of nodes with high local interconnectivity and relatively sparse connectivity to nodes in other modules ; see also Figure 1 for a schematic.
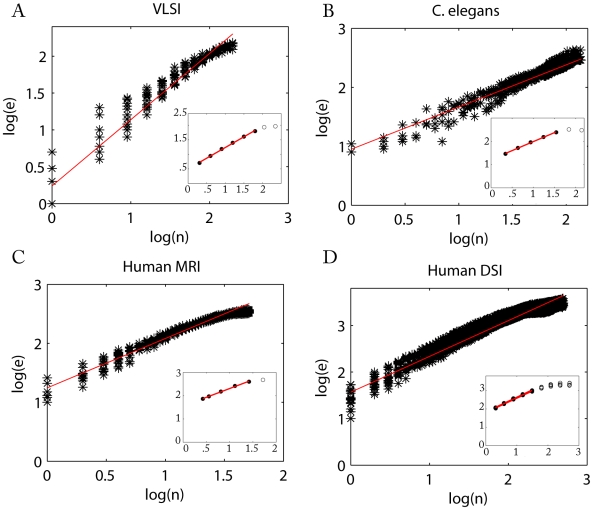
 ) and number of processing elements (
 ) in a physical box; data points for each physical box are shown by black stars. The Rent exponents for each system were estimated by the gradients of the fitted red lines (see Table 1). Note: Data and linear shown in D are for a single subject. Insets Topological Rentian scaling in nervous and computational systems is shown by a power law scaling of the number of nodes (
 ) in a topological partition and the number of edges crossing the boundary of that partition (
 ); data points for each topological partition are shown by black circles. The network topology of each system was iteratively partitioned in topological space. All networks contained a linear scaling regime (so-called Region I, filled black circles) and a regime at larger partition sizes where linear scaling broke down due to boundary effects (so-called Region II, empty black circles). The slope,
  , of the line through points within Region I was estimated using a weighted linear regression (red line); see Table 1. Note: Data and linear fits for all six DSI scans are shown in D.
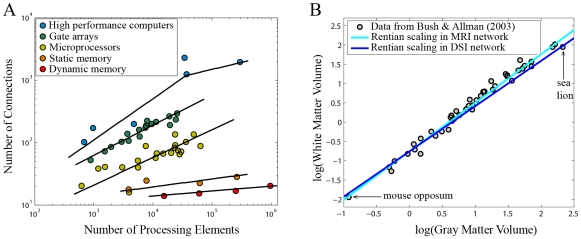
 is greater for high performance computers (shown in blue) than for simpler dynamic memory circuits (shown in red); see pp. 416–421 in for data values plotted here. In the cerebral hemispheres of mammalian brains (B), there is an allometric scaling relationship between white matter volume (related to connectivity of elements) and gray matter volume (related to number of processing elements); see Table 1 in for data values plotted here. The exponent of this volume scaling relationship over species,
  , is simply related to the Rent exponent of mammalian cerebral connectivity,
  . Lines fitted through the intercept of the data show the allometric scaling relationship predicted by the Rent exponent estimated for neuroimaging data on a single species (Homo sapiens), using MRI (cyan,
  ) and DSI (blue,
  ) (Table 1). Errors in the fits are smaller than the line width.
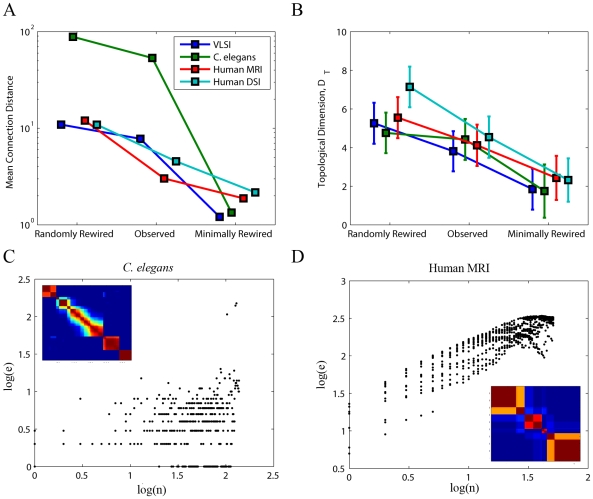
References
-
- Watts DJ, Strogatz SH. Collective dynamics of ‘small-world’ networks. Nature. 1998;393:440–442. - PubMed
-
- Ozik J, Hunt BR, Ott E. Growing networks with geographical attachment preference: emergence of small worlds. Phys Rev E. 2004;69:026108. - PubMed
-
- Masuda N, Miwa H, Konno N. Geographical threshold graphs with small-world and scale-free properties. Phys Rev E. 2005;71:036108. - PubMed
-
- Christie P, Stroobandt D. The interpretation and application of Rent's Rule. IEEE Trans VLSI Syst. 2000;8:639–648.
-
- Ozaktas HM. Paradigms of connectivity for computer circuits and networks. Opt Eng. 1992;31:1563–1567.
Publication types
MeSH terms
Grants and funding
LinkOut - more resources
Full Text Sources
Other Literature Sources
