. 2010 Apr 21;5(4):e10271.
doi: 10.1371/journal.pone.0010271.

Do pressures to publish increase scientists' bias? An empirical support from US States Data

Affiliations

Do pressures to publish increase scientists' bias? An empirical support from US States Data

Daniele Fanelli. PLoS One. .

Abstract

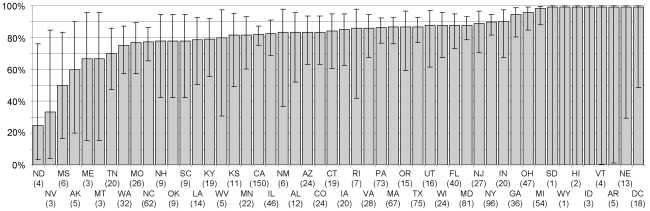
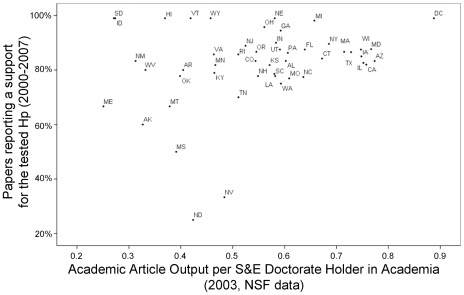
The growing competition and "publish or perish" culture in academia might conflict with the objectivity and integrity of research, because it forces scientists to produce "publishable" results at all costs. Papers are less likely to be published and to be cited if they report "negative" results (results that fail to support the tested hypothesis). Therefore, if publication pressures increase scientific bias, the frequency of "positive" results in the literature should be higher in the more competitive and "productive" academic environments. This study verified this hypothesis by measuring the frequency of positive results in a large random sample of papers with a corresponding author based in the US. Across all disciplines, papers were more likely to support a tested hypothesis if their corresponding authors were working in states that, according to NSF data, produced more academic papers per capita. The size of this effect increased when controlling for state's per capita R&D expenditure and for study characteristics that previous research showed to correlate with the frequency of positive results, including discipline and methodology. Although the confounding effect of institutions' prestige could not be excluded (researchers in the more productive universities could be the most clever and successful in their experiments), these results support the hypothesis that competitive academic environments increase not only scientists' productivity but also their bias. The same phenomenon might be observed in other countries where academic competition and pressures to publish are high.


Conflict of interest statement

Competing Interests: The author has declared that no competing interests exist.

Figures

Figure 1
Figure 1. Percentage of positive results by US state.
Percentage and 95% logit-derived confidence interval of papers published between 2000 and 2007 that supported a tested hypothesis, classified by the corresponding author's US state (sample size for each state is in parentheses). States are indicated by their official USPS abbreviations: AL-Alabama, AK-Alaska, AZ-Arizona, AR-Arkansas, CA-California, CO-Colorado, CT-Connecticut, DC-District of Columbia, FL-Florida, GA-Georgia, HI-Hawaii, ID-Idaho, IL-Illinois, IN-Indiana, IA-Iowa, KS-Kansas, KY-Kentucky, LA-Louisiana, ME-Maine, MD-Maryland, MA-Massachusetts, MI-Michigan, MN-Minnesota, MS-Mississippi, MO-Missouri, MT-Montana, NE-Nebraska, NV-Nevada, NH-New Hampshire, NJ-New Jersey, NM-New Mexico, NY-New York, NC-North Carolina, ND-North Dakota, OH-Ohio, OK-Oklahoma, OR-Oregon, PA-Pennsylvania, RI-Rhode Island, SC-South Carolina, SD-South Dakota, TN-Tennessee, TX-Texas, UT-Utah, VT-Vermont, VA-Virginia, WA-Washington, WV-West Virginia, WI-Wisconsin, WY-Wyoming. All US states were represented in the sample except Delaware.
Figure 2
Figure 2. “Positive” results by per-capita publication rate.
Percentage of papers supporting a tested hypothesis in each US state plotted against the state's academic article output per science and engineering doctorate holder in academia in 2003 (NSF data). Papers were published between 2000 and 2007 and classified by the US state of the corresponding author. US states are indicated by official USPS abbreviations. For abbreviations legend, see Figure 1.
Figure 3
Figure 3. “Positive” results by per-capita R&D expenditure in academia.
Percentage of papers supporting a tested hypothesis in each US state plotted against the state's academic R&D expenditure per science and engineering doctorate holder in academia in 2003 (NSF data, in million USD). Papers were published between 2000 and 2007 and classified by the US state of the corresponding author. US states are indicated by official USPS abbreviations. For abbreviations legend, see Figure 1.

Similar articles

Cited by

References

    1. Anderson MS, Ronning EA, De Vries R, Martinson BC. The perverse effects of competition on scientists' work and relationships. Science and Engineering Ethics. 2007;13:437–461. - PubMed
    1. Feller I. The determinants of research competitiveness among universities. In: Teich AH, editor. Competitiveness in academic research. Washington: American Association for the Advancement of Science; 1996. pp. 35–72.
    1. Song F, Eastwood AJ, Gilbody S, Duley L, Sutton AJ. Publication and related biases. Health Technology Assessment. 2000;4 - PubMed
    1. Dwan K, Altman DG, Arnaiz JA, Bloom J, Chan A-W, et al. Systematic review of the empirical evidence of study publication bias and outcome reporting bias. PLoS ONE. 2008;3:e3081. - PMC - PubMed
    1. Hopewell S, Clarke M, Stewart L, Tierney J. Time to publication for results of clinical trials (Review). Cochrane Database of Systematic Reviews 2007 - PMC - PubMed