. 2010 Apr 8:4:1.
doi: 10.3389/neuro.10.001.2010. eCollection 2010.

Signatures of synchrony in pairwise count correlations

Affiliations

Signatures of synchrony in pairwise count correlations

Tatjana Tchumatchenko et al. Front Comput Neurosci. .

Abstract

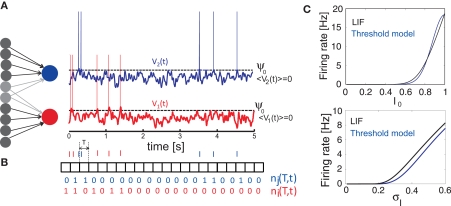
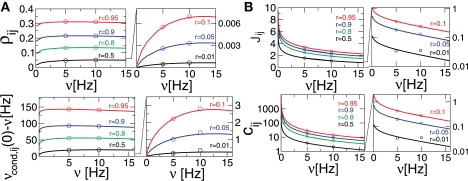
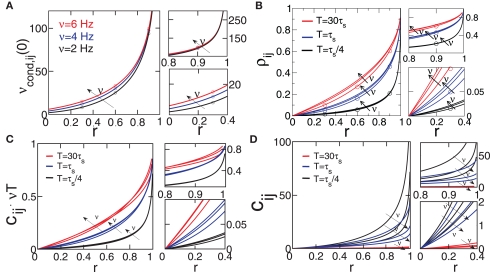
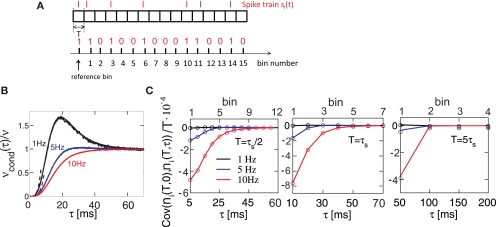
Concerted neural activity can reflect specific features of sensory stimuli or behavioral tasks. Correlation coefficients and count correlations are frequently used to measure correlations between neurons, design synthetic spike trains and build population models. But are correlation coefficients always a reliable measure of input correlations? Here, we consider a stochastic model for the generation of correlated spike sequences which replicate neuronal pairwise correlations in many important aspects. We investigate under which conditions the correlation coefficients reflect the degree of input synchrony and when they can be used to build population models. We find that correlation coefficients can be a poor indicator of input synchrony for some cases of input correlations. In particular, count correlations computed for large time bins can vanish despite the presence of input correlations. These findings suggest that network models or potential coding schemes of neural population activity need to incorporate temporal properties of correlated inputs and take into consideration the regimes of firing rates and correlation strengths to ensure that their building blocks are an unambiguous measures of synchrony.

Keywords: correlation coefficient; count correlations; population models; spike correlations; synchrony.


Figures

Figure 1
Figure 1
Generation of spike trains and transformation to spike counts. (A) Generation of spike trains from correlated voltage traces of two neurons with common presynaptic partners. (B) Red and blue vertical bars indicate the spike trains of two neurons. Squares show the boundaries of bins with duration T. ni(T,t) and nj(T,t) illustrate corresponding binned spike trains. (C) Firing rate vs. input current in the LIF model (first order solution) and the threshold model (Eq. 11) computed for σI = 0.25 (top), I0 = 0.6 (bottom) and ψ0 = 1, Vr = 0, τM = 15 ms and τI = 5 ms.
Figure 2
Figure 2
Dependence of correlation coefficient ρij and conditional rate νcond,ij(0) on firing rate and correlation strength. (A, top) ρij vs. ν, (A, bottom) νcond,ij(0) vs. ν, as in Eq. 19. (B, top) Pairwise couplings Jij vs. ν, as in Eq. 5. (B, bottom) cij vs. ν. All quantities are computed for τs = 10 ms, C(τ) as in Eq. 13 and ν = ν1 = ν2; circles denote the corresponding simulation results. ρij, cij and Jij are computed for T = τs/4.
Figure 3
Figure 3
Dependence of spike correlation measures on firing rate ν and correlation strength r. (A) νcond,ij(0) vs. r (B) ρij vs. r for bin widths T= 30τs (red), T= τs (blue), T = τs/4 (black). (C) cij νT vs. r. (D) cij vs. r. All quantities are computed for C(τ) as in Eq. 13, correlation time τs = 10 ms and three firing rates ν = 2, 4, 6 Hz, ν = ν1 = ν2; circles denote simulation results for the corresponding parameters.
Figure 4
Figure 4
Spike correlations and count correlations within a spike train. (A) Example of a binned spike train si(t), bins numbered with respect to a reference time bin. (B) νcond(τ) vs. τ for τ = 10 ms, numerical solution and simulations for the firing rates ν = 1 Hz (black), 5 Hz (blue) and ν = 10 Hz (red) are superimposed. Dotted lines denote the corresponding solutions for small τ (Eq. 23). (C) Cov(ni(T,0),nj(T,τ))/T vs. τ for τs = 10 ms, time bin T = τs/2 = 5 ms (left), T = 10 ms = τs (middle), T = 5τs = 50 ms (right). Circles denote the corresponding simulation points, adjacent time bins are denoted by the first points on the time axis. All spike correlations are computed for C(τ) as in Eq. 13.
Figure 5
Figure 5
Influence of temporal structure on pairwise spike correlations. (A) Spike cross correlations νcond,ij(τ) and auto correlations νcond(τ) for three voltage correlation functions Ci(τ). (B) Voltage correlations C1(τ)=σV2cosh(τ/τs)1 (blue), C2(τ)=σV2cosh(τ/(2τs))1cos(τ/2τs) (red), C3(τ)=σV2[exp(τ2/(6τs2))τ2/(3τs2)exp(τ2/(6τs2))](black). Note, all voltage correlations Ci(τ) share the same correlation time τs but have a different functional form. (C) ρij vs. T for voltage correlation functions Ci(τ). For all figures the correlation time τs = 10 ms, ν = 5 Hz, ν = ν1 = ν2; circles denote the corresponding simulation points.

References

    1. Abbott L., Dayan P. (1999). The effect of correlated variability on the accuracy of a population code. Neural Comput. 11, 91–10110.1162/089976699300016827 - DOI - PubMed
    1. Amari S. (2009). Measure of correlation orthogonal to change in firing rate. Neural Comput. 21, 960–97210.1162/neco.2008.03-08-729 - DOI - PubMed
    1. Averbeck B., Lee D. (2003). Neural noise and movement-related codes in the macaque supplementary motor area. J. Neurosci. 23, 7630–7641 - PMC - PubMed
    1. Azouz R., Gray C. M. (1999). Cellular mechanisms contributing to response variability of cortical neurons in vivo. J. Neurosci. 19, 2209–2223 - PMC - PubMed
    1. Binder M. D., Powers R. K. (2001). Relationship between simulated common synaptic input and discharge synchrony in cat spinal motoneurons. J. Neurophysiol. 86, 2266–2275 - PubMed

LinkOut - more resources