GABA(A) Increases Calcium in Subventricular Zone Astrocyte-Like Cells Through L- and T-Type Voltage-Gated Calcium Channels
- PMID: 20422045
- PMCID: PMC2857959
- DOI: 10.3389/fncel.2010.00008
GABA(A) Increases Calcium in Subventricular Zone Astrocyte-Like Cells Through L- and T-Type Voltage-Gated Calcium Channels
Abstract
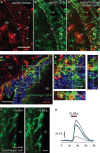
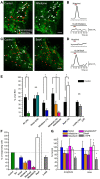
In the adult neurogenic subventricular zone (SVZ), the behavior of astrocyte-like cells and some of their functions depend on changes in intracellular Ca(2+) levels and tonic GABA(A) receptor activation. However, it is unknown whether, and if so how, GABA(A) receptor activity regulates intracellular Ca(2+) dynamics in SVZ astrocytes. To monitor Ca(2+) activity selectively in astrocyte-like cells, we used two lines of transgenic mice expressing either GFP fused to a Gq-coupled receptor or DsRed under the human glial fibrillary acidic protein (hGFAP) promoter. GABA(A) receptor activation induced Ca(2+) increases in 40-50% of SVZ astrocytes. GABA(A)-induced Ca(2+) increases were prevented with nifedipine and mibefradil, blockers of L- and T-type voltage-gated calcium channels (VGCC). The L-type Ca(2+) channel activator BayK 8644 increased the percentage of GABA(A)-responding astrocyte-like cells to 75%, suggesting that the majority of SVZ astrocytes express functional VGCCs. SVZ astrocytes also displayed spontaneous Ca(2+) activity, the frequency of which was regulated by tonic GABA(A) receptor activation. These data support a role for ambient GABA in tonically regulating intracellular Ca(2+) dynamics through GABA(A) receptors and VGCC in a subpopulation of astrocyte-like cells in the postnatal SVZ.
Keywords: GABA; GABA receptors; astrocyte; neurogenesis; progenitor cells; proliferation; stem cells; subventricular zone.
Figures


Similar articles
-
GABA release and uptake regulate neuronal precursor migration in the postnatal subventricular zone.J Neurosci. 2004 Sep 1;24(35):7623-31. doi: 10.1523/JNEUROSCI.1999-04.2004. J Neurosci. 2004. PMID: 15342728 Free PMC article.
-
Tonic activation of GLUK5 kainate receptors decreases neuroblast migration in whole-mounts of the subventricular zone.J Physiol. 2008 Aug 15;586(16):3783-93. doi: 10.1113/jphysiol.2008.155879. Epub 2008 Jun 19. J Physiol. 2008. PMID: 18565997 Free PMC article.
-
Neural progenitor cells regulate capillary blood flow in the postnatal subventricular zone.J Neurosci. 2012 Nov 14;32(46):16435-48. doi: 10.1523/JNEUROSCI.1457-12.2012. J Neurosci. 2012. PMID: 23152626 Free PMC article.
-
The multifaceted subventricular zone astrocyte: From a metabolic and pro-neurogenic role to acting as a neural stem cell.Neuroscience. 2016 May 26;323:20-8. doi: 10.1016/j.neuroscience.2015.10.053. Epub 2015 Nov 3. Neuroscience. 2016. PMID: 26546469 Free PMC article. Review.
-
Shades of gray: The delineation of marker expression within the adult rodent subventricular zone.Prog Neurobiol. 2013 Dec;111:1-16. doi: 10.1016/j.pneurobio.2013.07.003. Epub 2013 Aug 28. Prog Neurobiol. 2013. PMID: 23994259 Review.
Cited by
-
Neurogenesis in the Developing and Adult Brain-Similarities and Key Differences.Cold Spring Harb Perspect Biol. 2016 Jul 1;8(7):a018853. doi: 10.1101/cshperspect.a018853. Cold Spring Harb Perspect Biol. 2016. PMID: 27235475 Free PMC article. Review.
-
Imaging and recording subventricular zone progenitor cells in live tissue of postnatal mice.Front Neurosci. 2010 Jul 19;4:43. doi: 10.3389/fnins.2010.00043. eCollection 2010. Front Neurosci. 2010. PMID: 20700392 Free PMC article.
-
Deletion of Voltage-Gated Calcium Channels in Astrocytes during Demyelination Reduces Brain Inflammation and Promotes Myelin Regeneration in Mice.J Neurosci. 2020 Apr 22;40(17):3332-3347. doi: 10.1523/JNEUROSCI.1644-19.2020. Epub 2020 Mar 13. J Neurosci. 2020. PMID: 32169969 Free PMC article.
-
Gene Expression of GABAA Receptor Subunits and Association with Patient Survival in Glioma.Brain Sci. 2024 Mar 14;14(3):275. doi: 10.3390/brainsci14030275. Brain Sci. 2024. PMID: 38539663 Free PMC article.
-
Refuting the challenges of the developmental shift of polarity of GABA actions: GABA more exciting than ever!Front Cell Neurosci. 2012 Aug 28;6:35. doi: 10.3389/fncel.2012.00035. eCollection 2012. Front Cell Neurosci. 2012. PMID: 22973192 Free PMC article.
References
-
- Barakat L., Bordey A. (2002). GAT-1 and Reversible GABA Transport in Bergmann Glia in Slices. J. Neurophysiol. 88, 1407–1419 - PubMed
Grants and funding
LinkOut - more resources
Full Text Sources
Molecular Biology Databases
Miscellaneous

