

A two-dimensional simulation model of the bicoid gradient in Drosophila
- PMID: 20422054
- PMCID: PMC2858077
- DOI: 10.1371/journal.pone.0010275
A two-dimensional simulation model of the bicoid gradient in Drosophila
Abstract
Background: Bicoid (Bcd) is a Drosophila morphogenetic protein responsible for patterning the anterior structures in embryos. Recent experimental studies have revealed important insights into the behavior of this morphogen gradient, making it necessary to develop a model that can recapitulate the biological features of the system, including its dynamic and scaling properties.
Methodology/principal findings: We present a biologically realistic 2-D model of the dynamics of the Bcd gradient in Drosophila embryos. This model is based on equilibrium binding of Bcd molecules to non-specific, low affinity DNA sites throughout the Drosophila genome. It considers both the diffusion media within which the Bcd gradient is formed and the dynamic and other relevant properties of bcd mRNA from which Bcd protein is produced. Our model recapitulates key features of the Bcd protein gradient observed experimentally, including its scaling properties and the stability of its nuclear concentrations during development. Our simulation model also allows us to evaluate the effects of other biological activities on Bcd gradient formation, including the dynamic redistribution of bcd mRNA in early embryos. Our simulation results suggest that, in our model, Bcd protein diffusion is important for the formation of an exponential gradient in embryos.
Conclusions/significance: The 2-D model described in this report is a simple and versatile simulation procedure, providing a quantitative evaluation of the Bcd gradient system. Our results suggest an important role of Bcd binding to non-specific, low-affinity DNA sites in proper formation of the Bcd gradient in our model. They demonstrate that highly complex biological systems can be effectively modeled with relatively few parameters.
Conflict of interest statement
Figures
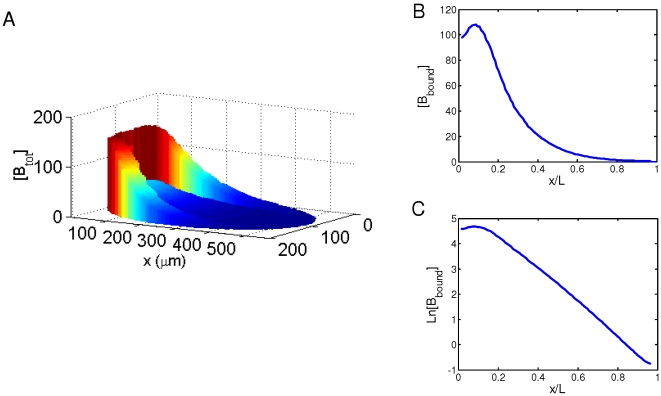

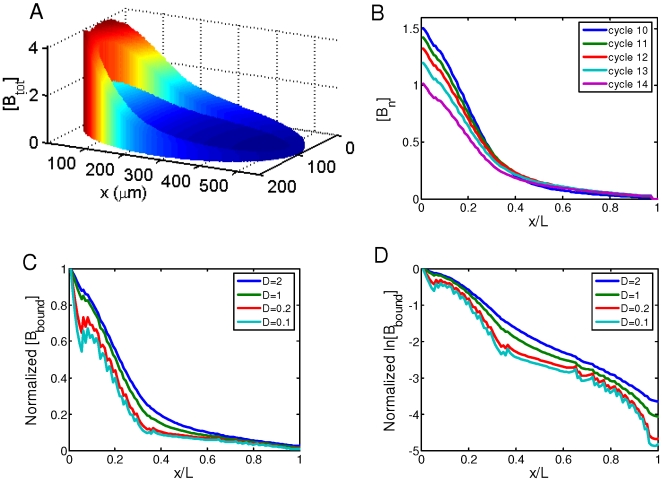
 [Bbound]/nuclear number; all in arbitrary units) within the cortical layer at nuclear cycles 10–14. While [Bbound] increases after each nuclear division (as seen in panel A), [Bn] remains stable in the simulated embryo (as seen in panel B). The length constant λ of the simulated [Bbound] within the cortical layer at nuclear cycles 10–14 is: 72, 79, 85, 89 and 92 µm, respectively. The Adjusted R
2 values of exponential fitting of simulated [Bbound] during nuclear cycles 10–14 are, respectively: 0.9985, 0.9988, 0.9992, 0.9996 and 0.9998 for the fitting region of x/L = 0.2 to 0.7; and 0.9454, 0.9470, 0.9456, 0.9402, and 0.9296 for the fitting region of x/L = 0 to 0.7.
[Bbound]/nuclear number; all in arbitrary units) within the cortical layer at nuclear cycles 10–14. While [Bbound] increases after each nuclear division (as seen in panel A), [Bn] remains stable in the simulated embryo (as seen in panel B). The length constant λ of the simulated [Bbound] within the cortical layer at nuclear cycles 10–14 is: 72, 79, 85, 89 and 92 µm, respectively. The Adjusted R
2 values of exponential fitting of simulated [Bbound] during nuclear cycles 10–14 are, respectively: 0.9985, 0.9988, 0.9992, 0.9996 and 0.9998 for the fitting region of x/L = 0.2 to 0.7; and 0.9454, 0.9470, 0.9456, 0.9402, and 0.9296 for the fitting region of x/L = 0 to 0.7.


Similar articles
-
Distance measurements via the morphogen gradient of Bicoid in Drosophila embryos.BMC Dev Biol. 2010 Aug 2;10:80. doi: 10.1186/1471-213X-10-80. BMC Dev Biol. 2010. PMID: 20678215 Free PMC article.
-
Adaptation of the length scale and amplitude of the Bicoid gradient profile to achieve robust patterning in abnormally large Drosophila melanogaster embryos.Development. 2014 Jan;141(1):124-35. doi: 10.1242/dev.098640. Epub 2013 Nov 27. Development. 2014. PMID: 24284208 Free PMC article.
-
Probing intrinsic properties of a robust morphogen gradient in Drosophila.Dev Cell. 2008 Oct;15(4):558-67. doi: 10.1016/j.devcel.2008.09.004. Dev Cell. 2008. PMID: 18854140 Free PMC article.
-
A matter of time: Formation and interpretation of the Bicoid morphogen gradient.Curr Top Dev Biol. 2020;137:79-117. doi: 10.1016/bs.ctdb.2019.11.016. Epub 2019 Dec 27. Curr Top Dev Biol. 2020. PMID: 32143754 Review.
-
How to get ahead: the origin, evolution and function of bicoid.Bioessays. 2005 Sep;27(9):904-13. doi: 10.1002/bies.20285. Bioessays. 2005. PMID: 16108065 Review.
Cited by
-
The formation of the Bicoid morphogen gradient requires protein movement from anteriorly localized mRNA.PLoS Biol. 2011 Mar;9(3):e1000596. doi: 10.1371/journal.pbio.1000596. Epub 2011 Mar 1. PLoS Biol. 2011. PMID: 21390295 Free PMC article.
-
Transcriptional activators and activation mechanisms.Protein Cell. 2011 Nov;2(11):879-88. doi: 10.1007/s13238-011-1101-7. Epub 2011 Dec 17. Protein Cell. 2011. PMID: 22180087 Free PMC article. Review.
-
Distance measurements via the morphogen gradient of Bicoid in Drosophila embryos.BMC Dev Biol. 2010 Aug 2;10:80. doi: 10.1186/1471-213X-10-80. BMC Dev Biol. 2010. PMID: 20678215 Free PMC article.
-
Two-Exponential Models of Gene Expression Patterns for Noisy Experimental Data.J Comput Biol. 2018 Nov;25(11):1220-1230. doi: 10.1089/cmb.2017.0063. Epub 2018 Aug 17. J Comput Biol. 2018. PMID: 30117746 Free PMC article.
-
Mechanisms and Measurements of Scale Invariance of Morphogen Gradients.Methods Mol Biol. 2018;1863:251-262. doi: 10.1007/978-1-4939-8772-6_14. Methods Mol Biol. 2018. PMID: 30324602 Free PMC article.
References
-
- Martinez Arias A, Hayward P. Filtering transcriptional noise during development: concepts and mechanisms. Nat Rev Genet. 2006;7:34–44. - PubMed
-
- Kerszberg M, Wolpert L. Specifying positional information in the embryo: looking beyond morphogens. Cell. 2007;130:205–209. - PubMed
-
- Lander AD. Morpheus unbound: reimagining the morphogen gradient. Cell. 2007;128:245–256. - PubMed
-
- Lewis J. From signals to patterns: space, time, and mathematics in developmental biology. Science. 2008;322:399–403. - PubMed
-
- Houchmandzadeh B, Wieschaus E, Leibler S. Establishment of developmental precision and proportions in the early Drosophila embryo. Nature. 2002;415:798–802. - PubMed
Publication types
MeSH terms
Substances
Grants and funding
LinkOut - more resources
Full Text Sources
Molecular Biology Databases
