The Epworth Sleepiness Scale: self-administration versus administration by the physician, and validation of a French version
- PMID: 20422065
- PMCID: PMC2866221
- DOI: 10.1155/2010/438676
The Epworth Sleepiness Scale: self-administration versus administration by the physician, and validation of a French version
Abstract
Background/objectives: The Epworth Sleepiness Scale (ESS) measures sleepiness and is used for, among others, patients with obstructive sleep apnea (OSA). The questionnaire is usually self-administered, but may be physician administered. The aim was to compare the two methods of administration and to validate a French version.
Methods: Consecutive patients presenting to the sleep clinic at a tertiary care centre completed a self-administered questionnaire containing the ESS. During the medical interview the same day, one of three pulmonologists who specialized in sleep medicine administered the ESS. Correlations with the apnea-hypopnea index and mean sleep latencies were used to assess construct validity, while results of previous self-administered ESS questionnnaires in untreated and recently treated OSA patients were used to test reproducibility and longitudinal construct validity, respectively.
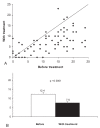
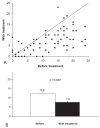
Results: In OSA patients, the ESS weakly correlated with the apnea-hypopnea index (r=0.224; P=0.05; n=120) and negatively with mean sleep latency. For untreated patients (test-retest), the mean (+/- SD) average score was unchanged (10.3+/-6.0 to 10.8+/-6.5; P=0.35; n=56) after a median of seven months. With continuous positive airway pressure use, the mean score decreased from 12.4+/-6.8 to 7.6+/-5.0 after 40.2 months (P<0.0001; n=68). For all subjects, the ESS score obtained by the physician was less than that of the self-administered result (9.4+/-5.9 versus 8.5+/-5.8; P<0.0001 [paired t test]; n=188).
Conclusions: In a sleep clinic population, the French version of the ESS performed similarly to the English version. However, the systematic underscoring during physician administration may be important to consider in the research setting if questionnaire administration methods are not consistent.
HISTORIQUE ET OBJECTIFS :: L’échelle de somnolence d’Epworth (ÉSE) mesure la somnolence et est utilisée, entre autres, auprès de patients présentant une apnée obstructive du sommeil (AOS). D’ordinaire, le questionnaire est autoadministré, mais il peut également l’être par le médecin. Les chercheurs souhaitaient comparer les deux modes d’administration et à valider une version française.
MÉTHODOLOGIE :: Des patients consécutifs consultant à la clinique du sommeil d’un centre de soins tertiaires ont rempli un questionnaire autoadministré contenant l’ÉSE. Pendant l’entrevue médicale, le même jour, l’un des trois pneumologues spécialisés en médecine du sommeil a également administré l’ÉSE. Les chercheurs ont utilisé les corrélations avec l’indice d’apnée-hypopnée et les latences de sommeil moyennes pour évaluer la validité conceptuelle, tandis qu’ils se sont servi des résultats des questionnaires autoadministrés de l’ÉSE chez les patients présentant une AOS non traitée ou traitée récemment pour vérifier la reproductibilité et la validité conceptuelle longitudinale, respectivement.
RÉSULTATS :: Chez les patients ayant une AOS, l’ÉSE était faiblement corrélée avec l’indice d’apnée-hypopnée (r=0,224; P=0,05; n=120) et corrélée négativement avec la latence de sommeil moyenne. Chez les patients non traités (test-retest), l’indice moyen (± ÉT) demeurait inchangé (10,3±6,0 à 10,8±6,5; P=0,35; n=56) après une période médiane de sept mois. En ajoutant une pression positive continue, l’indice moyen fléchissait de 12,4±6,8 à 7,6±5,0 au bout de 40,2 mois (P<0,0001; n=68). Chez tous les sujets, l’indice d’ÉSE obtenu par le médecin était inférieur au résultat du questionnaire autoadministré (9,4±5,9 par rapport à 8,5±5,8; P<0,0001 [test t jumelé]; n=188).
CONCLUSIONS :: Au sein de la population d’une clinique de sommeil, la version française de l’ÉSE donnait des résultats similaires à la version anglaise. Cependant, en milieu de recherche, il serait peut-être important de tenir compte du pointage systématiquement inférieur pendant l’administration par le médecin si les modes d’administration des questionnaires ne sont pas constants.
Figures


Similar articles
-
Correlation between the Epworth Sleepiness Scale and the Maintenance of Wakefulness Test in Obstructive Sleep Apnea Patients Treated with Positive Airway Pressure.Respir Med Res. 2020 Nov;78:100787. doi: 10.1016/j.resmer.2020.100787. Epub 2020 Aug 28. Respir Med Res. 2020. PMID: 32920453
-
Epworth sleepiness scale in obstructive sleep disordered breathing: the reliability and validity of the Thai version.Sleep Breath. 2011 Sep;15(3):571-7. doi: 10.1007/s11325-010-0405-9. Epub 2010 Sep 11. Sleep Breath. 2011. PMID: 20835769
-
Validation of a Hindi version of the Epworth Sleepiness Scale (ESS) at AIIMS, New Delhi in sleep-disordered breathing.Sleep Breath. 2016 Dec;20(4):1225-1230. doi: 10.1007/s11325-016-1344-x. Epub 2016 May 18. Sleep Breath. 2016. PMID: 27193743
-
Diagnostic accuracy of the Berlin questionnaire, STOP-BANG, STOP, and Epworth sleepiness scale in detecting obstructive sleep apnea: A bivariate meta-analysis.Sleep Med Rev. 2017 Dec;36:57-70. doi: 10.1016/j.smrv.2016.10.004. Epub 2016 Nov 5. Sleep Med Rev. 2017. PMID: 27919588 Review.
-
Measures of sleep in rheumatologic diseases: Epworth Sleepiness Scale (ESS), Functional Outcome of Sleep Questionnaire (FOSQ), Insomnia Severity Index (ISI), and Pittsburgh Sleep Quality Index (PSQI).Arthritis Care Res (Hoboken). 2011 Nov;63 Suppl 11(0 11):S287-96. doi: 10.1002/acr.20544. Arthritis Care Res (Hoboken). 2011. PMID: 22588751 Free PMC article. Review. No abstract available.
Cited by
-
Clustering of intuitive eating and psychological health identifies subgroups associated with weight loss following semaglutide.Obesity (Silver Spring). 2025 May;33(5):892-902. doi: 10.1002/oby.24262. Epub 2025 Apr 3. Obesity (Silver Spring). 2025. PMID: 40177856 Free PMC article.
-
Pittsburgh and Epworth sleep scale items: accuracy of ratings across different reporting periods.Behav Sleep Med. 2013;11(3):173-88. doi: 10.1080/15402002.2012.654549. Epub 2012 Dec 3. Behav Sleep Med. 2013. PMID: 23205491 Free PMC article.
-
The Epworth Sleepiness Scale in Portuguese adults: from classical measurement theory to Rasch model analysis.Sleep Breath. 2015 May;19(2):693-701. doi: 10.1007/s11325-014-1078-6. Epub 2014 Nov 20. Sleep Breath. 2015. PMID: 25410146
-
The relationship between quality of life, sleep quality, mental health, and physical activity in an international sample of college students: a structural equation modeling approach.Front Public Health. 2024 Jul 10;12:1397924. doi: 10.3389/fpubh.2024.1397924. eCollection 2024. Front Public Health. 2024. PMID: 39050600 Free PMC article.
-
Leisure-Time Physical Activity and Sedentary Behavior and Their Cross-Sectional Associations with Excessive Daytime Sleepiness in the French SU.VI.MAX-2 Study.Int J Behav Med. 2016 Apr;23(2):143-52. doi: 10.1007/s12529-015-9501-3. Int J Behav Med. 2016. PMID: 26249724
References
-
- Johns MW. A new method for measuring daytime sleepiness: The Epworth sleepiness scale. Sleep. 1991;14:540–5. - PubMed
-
- Roth T, Drake C. Evolution of insomnia: Current status and future direction. Sleep Med. 2004;5(Suppl 1):S23–S30. - PubMed
-
- Dauvilliers Y. Differential diagnosis in hypersomnia. Curr Neurol Neurosci Rep. 2006;6:156–62. - PubMed
-
- Fry JM. Treatment modalities for narcolepsy. Neurology. 1998;502(Suppl 1):S43–S48. - PubMed
Publication types
MeSH terms
LinkOut - more resources
Full Text Sources
Medical

