

Mammalian carboxylesterase 3: comparative genomics and proteomics
- PMID: 20422440
- PMCID: PMC2896070
- DOI: 10.1007/s10709-010-9438-z
Mammalian carboxylesterase 3: comparative genomics and proteomics
Abstract
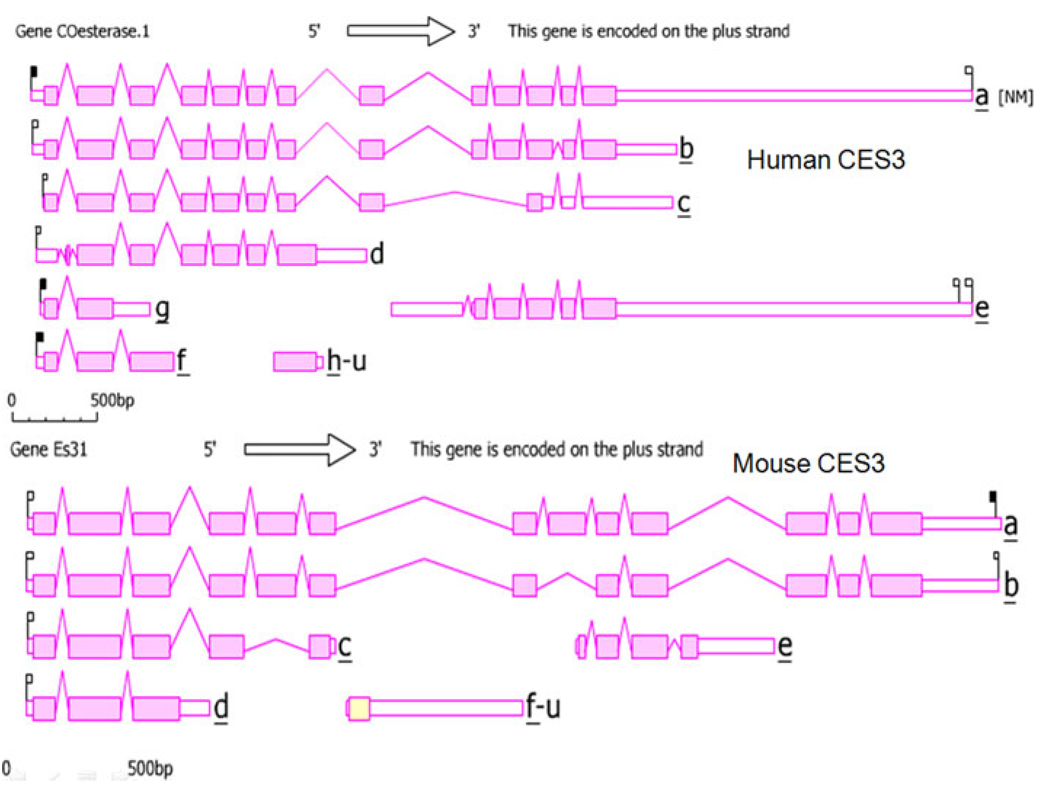
At least five families of mammalian carboxylesterases (CES) catalyse the hydrolysis or transesterification of a wide range of drugs and xenobiotics and may also participate in fatty acyl and cholesterol ester metabolism. In this study, in silico methods were used to predict the amino acid sequences, secondary and tertiary structures, and gene locations for CES3 genes and encoded proteins using data from several mammalian genome projects. Mammalian CES3 genes were located within a CES gene cluster with CES2 and CES6 genes, usually containing 13 exons transcribed on the positive DNA strand. Evidence is reported for duplicated CES3 genes for the chimp and mouse genomes. Mammalian CES3 protein subunits shared 58-97% sequence identity and exhibited sequence alignments and identities for key CES amino acid residues as well as extensive conservation of predicted secondary and tertiary structures with those previously reported for human CES1. The human genome project has previously reported CES3 mRNA isoform expression in several tissues, particularly in colon, trachea and in brain. Predicted human CES3 isoproteins were apparently derived from exon shuffling and are likely to be secreted extracellularly or retained within the cytoplasm. Mouse CES3-like transcripts were localized in specific regions of the mouse brain, including the cerebellum, and may play a role in the detoxification of drugs and xenobiotics in neural tissues and other tissues of the body. Phylogenetic analyses demonstrated the relationships and potential evolutionary origins of the mammalian CES3 family of genes which were related to but distinct from other mammalian CES gene families.
Figures


Similar articles
-
A new class of mammalian carboxylesterase CES6.Comp Biochem Physiol Part D Genomics Proteomics. 2009 Sep;4(3):209-17. doi: 10.1016/j.cbd.2009.03.002. Comp Biochem Physiol Part D Genomics Proteomics. 2009. PMID: 20161041 Free PMC article.
-
Opossum carboxylesterases: sequences, phylogeny and evidence for CES gene duplication events predating the marsupial-eutherian common ancestor.BMC Evol Biol. 2008 Feb 20;8:54. doi: 10.1186/1471-2148-8-54. BMC Evol Biol. 2008. PMID: 18289373 Free PMC article.
-
Horse carboxylesterases: evidence for six CES1 and four families of CES genes on chromosome 3.Comp Biochem Physiol Part D Genomics Proteomics. 2009 Mar;4(1):54-65. doi: 10.1016/j.cbd.2008.10.004. Epub 2008 Nov 5. Comp Biochem Physiol Part D Genomics Proteomics. 2009. PMID: 20403742 Free PMC article.
-
Human carboxylesterases: an update on CES1, CES2 and CES3.Protein Pept Lett. 2009;16(10):1207-14. doi: 10.2174/092986609789071324. Protein Pept Lett. 2009. PMID: 19508181 Review.
-
Genomic structure and transcriptional regulation of the rat, mouse, and human carboxylesterase genes.Drug Metab Rev. 2007;39(1):1-15. doi: 10.1080/03602530600952164. Drug Metab Rev. 2007. PMID: 17364878 Review.
Cited by
-
Human carboxylesterases and fluorescent probes to image their activity in live cells.RSC Med Chem. 2021 May 18;12(7):1142-1153. doi: 10.1039/d1md00073j. eCollection 2021 Jul 21. RSC Med Chem. 2021. PMID: 34355180 Free PMC article. Review.
-
Carboxylesterases are uniquely expressed among tissues and regulated by nuclear hormone receptors in the mouse.Drug Metab Dispos. 2013 Jan;41(1):40-9. doi: 10.1124/dmd.112.048397. Epub 2012 Sep 25. Drug Metab Dispos. 2013. PMID: 23011759 Free PMC article.
-
Nuclear-lipid-droplet proteome: carboxylesterase as a nuclear lipase involved in lipid-droplet homeostasis.Heliyon. 2021 Mar 17;7(3):e06539. doi: 10.1016/j.heliyon.2021.e06539. eCollection 2021 Mar. Heliyon. 2021. PMID: 33817385 Free PMC article.
-
Recommended nomenclature for five mammalian carboxylesterase gene families: human, mouse, and rat genes and proteins.Mamm Genome. 2010 Oct;21(9-10):427-41. doi: 10.1007/s00335-010-9284-4. Epub 2010 Oct 8. Mamm Genome. 2010. PMID: 20931200 Free PMC article.
-
Carboxylesterases in lipid metabolism: from mouse to human.Protein Cell. 2018 Feb;9(2):178-195. doi: 10.1007/s13238-017-0437-z. Epub 2017 Jul 4. Protein Cell. 2018. PMID: 28677105 Free PMC article. Review.
References
-
- Ahmad S, Forgash AJ. Nonoxidative enzymes in the metabolism of insecticides. Drug Metab Rev. 1976;5:141–164. - PubMed
-
- Aida K, Moore R, Negishi M. Cloning and sequencing of a novel, male-predominant carboxylesterase in mouse liver. Biochim Biophys Acta. 1993;1174:72–74. - PubMed
-
- Altschul F, Vyas V, Cornfield A, Goodin S, Ravikumar TS, Rubin EH, Gupta E. Basic local alignment search tool. J Mol Biol. 1990;215:403–410. - PubMed
-
- Becker A, Bottcher A, Lackner KJ, Fehringer P, Notka F, Aslandis C, Schmithz C. Purification, cloning and expression of a human enzyme with acyl coenzyme A: cholesterol acyltransferase activity, which is identical to liver carboxylesterase. Arterioscler Thromb. 1994;14:1346–1355. - PubMed
-
- Bencharit S, Morton CL, Xue Y, Potter PM, Redinbo MR. Structural basis of heroin and cocaine metabolism by a promiscuous human drug-processing enzyme. Nat Struct Biol. 2003;10:349–356. - PubMed
Publication types
MeSH terms
Substances
Grants and funding
LinkOut - more resources
Full Text Sources
Molecular Biology Databases
Miscellaneous
