. 2010 May 15;82(10):4078-88.
doi: 10.1021/ac1001383.

Characterization of glycosaminoglycans by 15N NMR spectroscopy and in vivo isotopic labeling

Affiliations

Characterization of glycosaminoglycans by 15N NMR spectroscopy and in vivo isotopic labeling

Vitor H Pomin et al. Anal Chem. .

Erratum in

  • Anal Chem. 2011 Feb 1;83(3):1162

Abstract

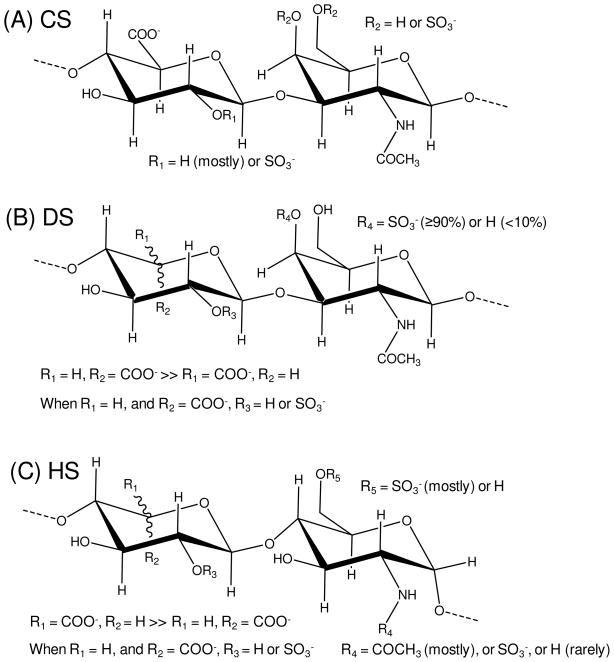
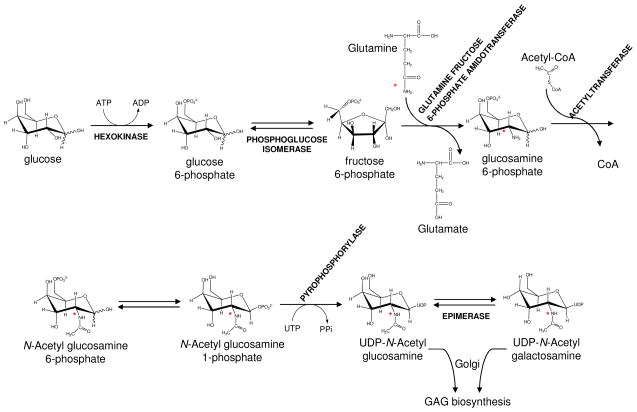
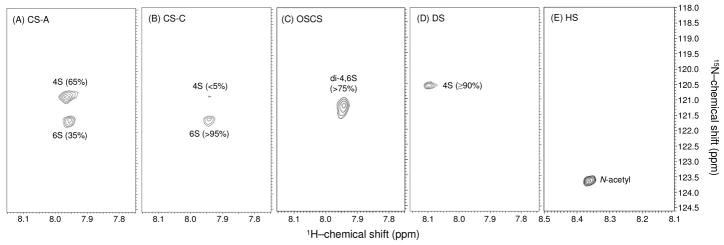
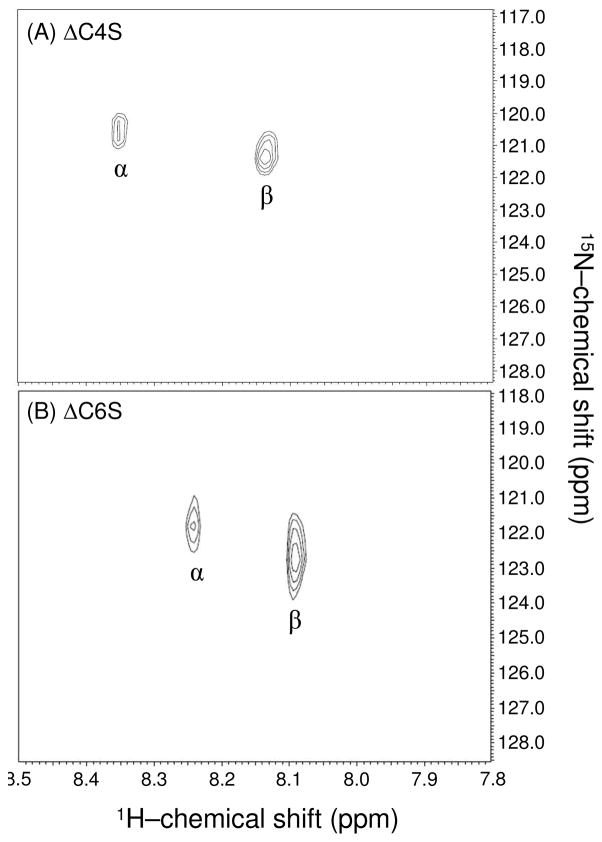
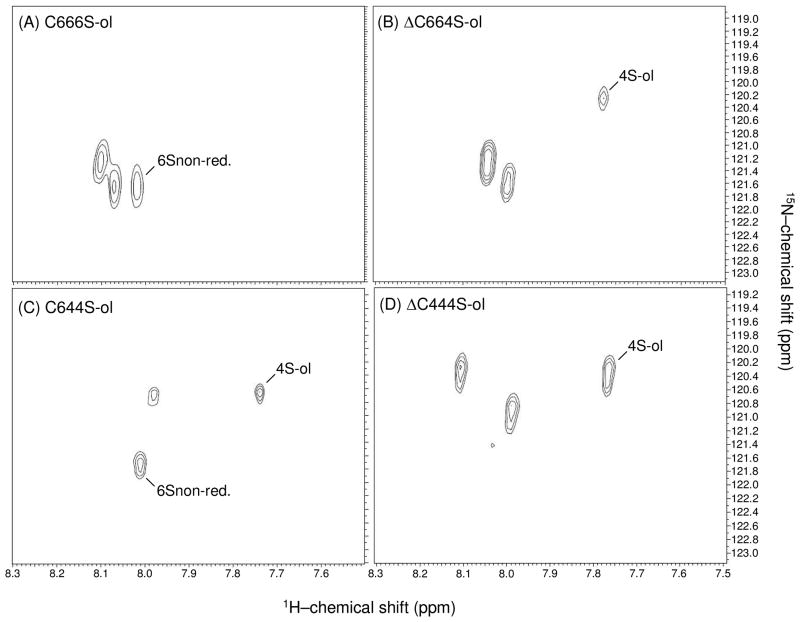
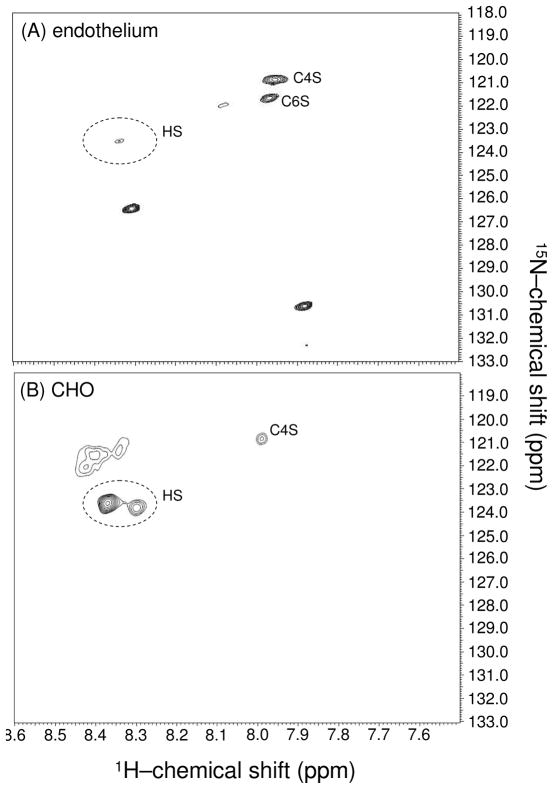
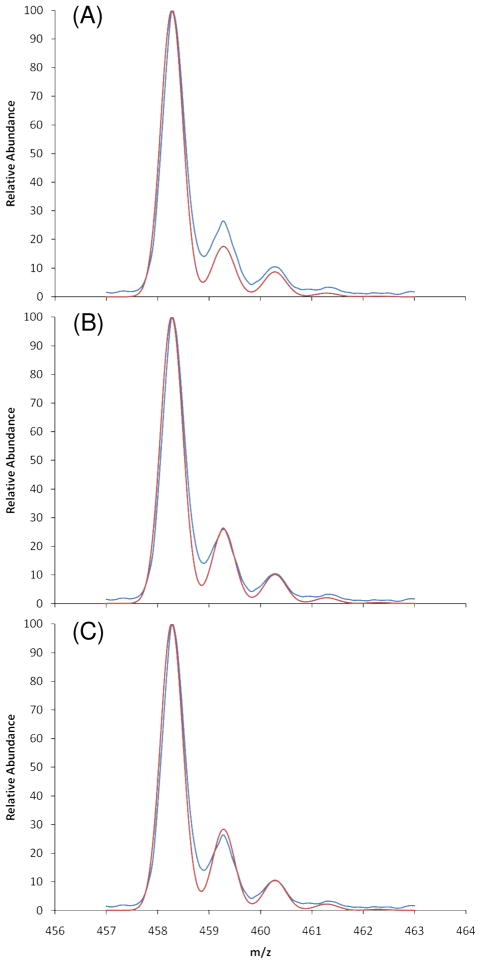
Characterization of glycosaminoglycans (GAGs), including chondroitin sulfate (CS), dermatan sulfate (DS), and heparan sulfate (HS), is important in developing an understanding of cellular function and in assuring quality of preparations destined for biomedical applications. While use of (1)H and (13)C NMR spectroscopy has become common in characterization of these materials, spectra are complex and difficult to interpret when a more heterogeneous GAG type or a mixture of several types is present. Herein a method based on (1)H-(15)N two-dimensional NMR experiments is described. The (15)N- and (1)H-chemical shifts of amide signals from (15)N-containing acetylgalactosamines in CSs are shown to be quite sensitive to the sites of sulfation (4-, 6-, or 4,6-) and easily distinguishable from those of DS. The amide signals from residual (15)N-containing acetylglucosamines in HS are shown to be diagnostic of the presence of these GAG components as well. Most data were collected at natural abundance of (15)N despite its low percentage. However enrichment of the (15)N-content in GAGs using metabolic incorporation from (15)N-glutamine added to cell culture media is also demonstrated and used to distinguish metabolic states in different cell types.


Figures

Figure 1
Figure 1
Major repeating disaccharide units of the most abundant ECM GAGs found in mammalian cell surface proteoglycans. (A) The backbone of CS is homogeneously composed of [-4)-GlcA-β(1-3)-GalNAc-β(1-]n. (B) The backbone of DS (also known as CS-B) is mostly composed of [-4)-IdoA-α(1-3)-GalNAc-β(1-]n, but it also contains minor amounts of [-4)-GlcA-β(1-3)-GalNAc-β(1-]n. (C) The HS backbone is mostly composed of [-4)-GlcA-β(1-4)-GlcNAc-α(1-]n, but it also contains regions of [-4)-IdoA-α(1-4)-GlcNAc-α(1-]n.
Figure 2
Figure 2
Schematic representation of the cytosolic biosynthesis of 15N-labeled N-acetyl hexosamines that will be further used inside the Golgi apparatus for building up the GAG backbones in proteoglycans. The names of the enzymes are fully written in upper cases while the substrates and products are mostly written in lower cases. The 15N-labeled sites are indicated with red asterisks. For more details about GAG biosynthesis see also Sugahara et al., 2003, or Esko and Lindahl, 2001.
Figure 3
Figure 3
Comparative NMR analysis of 1 H- and 15N-chemical shifts of amide protons from CS types (A-D), and mammalian HS (E) using 1H-15N-gHSQC spectra. (A) The CS-A from bovine trachea possesses ~ 65% of 4-sulfation, and ~ 35% of 6-sulfation GalNAc residues, whereas (B) the CS-C from shark cartilage has over 95% 6-sulfation GalNAc units. (C) The OSCS possesses over 75% of 4,6-di-sulfation GalNAc units. (D) The DS, also known as CS-B, from porcine intestinal mucosa is composed of ≥ 90% 4-sulfated GalNAc units. (E) The mammalian HS reveals only one peak that necessarily belongs to its 15N-acetylated glucosaminyl unit. Note the different 1H chemical shift scale in (E).
Figure 4
Figure 4
Comparative NMR analysis of α- and β-1H/15N-resonances of unreduced unsaturated 4- (A), and 6-sulfated (B) CS dimers obtained from ABC lyase digestion, using 1H-15N gHSQC spectra. The β-/β-signals arises from mutarotation of anomerics in aqueous solution, which the equilibrium ratio is 3.5/6.5.
Figure 5
Figure 5
Comparative NMR analysis of reduced CS hexamers from ABC lyase (A,C), and hyaluronidase (B,D) digestions using 1H-15N gHSQC spectra. (A) C666S-ol, (B) ΔC664S-ol, (C) ΔC644S-ol, and (D) C444-ol. The peaks assigned as 6Snon-red., and 4S-ol belong to the 6-sulfated and 4-sulfated GalNAc units from non-reducing and reduced terminals respectively.
Figure 6
Figure 6
1H-15N gHSQC spectra of 15N-labeled negatively charged molecules extracted from the mouse lung endothelial cells (A), and (B) CHO cells.
Figure 7
Figure 7
MS spectra of the endothelial ΔC4S dimers. The blue peaks represent the measured spectra while the red peaks represent the simulated 15N-isotopic percentage in natural abundance of 0.37% (A), with (B) 8% of 15N incorporation (B), and with 10% 15N incorporation (C).

Similar articles

Cited by

References

    1. Heino J, Kapyla J. Curr Pharm Des. 2009;15:1309–1317. - PubMed
    1. Yu F, Wolff JJ, Amster IJ, Prestegard JH. J Am Chem Soc. 2007;129:13288–13297. - PubMed
    1. Gandhi NS, Mancera RL. Chem Biol Drug Des. 2008;72:455–482. - PubMed
    1. Iozzo RV. Annu Rev Biochem. 1998;67:609–652. - PubMed
    1. Beaulieu JF, Vachon PH, Chartrand S. Anat Embryol. 1991;183:363–369. - PubMed

Publication types

MeSH terms