Review
. 2010 May 12;110(5):3237-77.
doi: 10.1021/cr100012c.

Mass spectrometric imaging for biomedical tissue analysis

Affiliations
Review

Mass spectrometric imaging for biomedical tissue analysis

Kamila Chughtai et al. Chem Rev. .
No abstract available


Figures

Figure 1
Figure 1
Schematic representation of MALDI desorption and ionization process. Reprinted with permission from ref. Copyright 2008 National High Magnetic Field Laboratory.
Figure 2
Figure 2
Schematic representation of SIMS desorption and ionization process. Reprinted with permission from ref. Copyright 2010 NESAC/BIO and University of Washington.
Figure 3
Figure 3
Desorption electrospray ionization (DESI). (a) Schematic representation of DESI desorption and ionization process; (b) brain tissue imaging analysis using DESI. Reprinted with permission from ref. Copyright 2008 Elsevier.
Figure 4
Figure 4
Degradation of molecular species during a time course of incubation of the tissue at RT visualized by MALDI-MSI. (a) Coronal sections of mouse brain warmed on the target slide for 0, 0.5, 1, 1.75, 2.75 and 5.25 min. Upper and lower series are from two separate technical replicates. (b) Parasagittal sections of mouse brain incubated for 5 min and Sample 1 was heat treated (Denator system) to denature proteins immediately after tissue collection. Sample 2 is the corresponding untreated tissue and sample 3 was heat treated on the slide after sectioning and thaw mounting. Reprinted with permission from ref. Copyright 2008 Wiley Interscience.
Figure 5
Figure 5
MALDI molecular images obtained from 2-years-old FFPE rat brain tissue section subjected to on-tissue trypsin digestion. Reprinted with permission from ref. Copyright 2007 American Chemical Society.
Figure 6
Figure 6
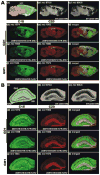
MALDI IMS analysis of fresh-frozen and ethanol-preserved sagittal mouse brain sections. (A) Photomicrographs of the sections after H&E staining; (a) cerebellum, (b) cerebral cortex, (c) main olfactory bulb, (d) midbrain, (e) hypothalamus, (f) pons, (g) hippocampal formation, (h) corpus callosum, (i) medulla, (j) thalamus. (B-I) Corresponding ion density maps from a subset of proteins observed in common from both sections. Reprinted with permission from ref. Copyright 2008 American Chemical Society.
Figure 7
Figure 7
Analysis of the effect of OCT on MALDI signals from rat liver. (A) Procedure where OCT is used to adhere the tissue to the sample stage but does not come into contact with the sliced tissue. The resulting spectrum shows many intense signals between m/z 4500 and 10 500. (B) The tissue was embedded in OCT and attached to the sample stage. The resulting spectrum contains only about half of the signals as that in (A). Reprinted with permission from ref. Copyright 2003 Wiley Interscience.
Figure 8
Figure 8
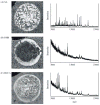
Analysis of matrix crystallization from solutions of different matrix concentration. Solutions of sinapinic acid in 50: 50 acetonitrile/0.1% TFA in water at concentrations of (A) 10 mg/mL, (B) 20 mg/mL, and (C) saturated (>30 mg/mL). The spectra obtained from solutions spotted on mouse liver tissue sections showed that the greater the concentration of matrix, the greater the crystal coverage, and the better the resulting mass spectrum. Reprinted with permission from ref. Copyright 2003 Wiley Interscience.
Figure 9
Figure 9
Analysis of matrix crystallization on tissue. Comparison of three different matrices, (A) SA, (B) DHB, and (C) HCCA at concentration 20 mg/mL (in 50:50 acetonitrile/0.1% TFA in water). SA and HCCA form dense crystals on the tissue, while DHB does not crystallize on the rim of the spot. Reprinted with permission from ref. Copyright 2003 Wiley Interscience.
Figure 10
Figure 10
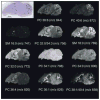
An optical image of H&E-stained sagittal mouse brain section showing the anatomy of the brain and selected ion images from a dry-coated serial sagittal section showing the phospholipid patterns in the brain. CB, cerebellum; CC, corpus callosum; CTX, cerebral cortex; HY, hypothalamus; M, medulla; P, pons; TH, thalamus; V4, fourth ventricle; VL, lateral ventricle; PC, phosphatidylcholine; SM, sphingomyelin. Reprinted with permission from ref. Copyright 2008 Elsevier.
Figure 11
Figure 11
Comparison of dry matrix spraying and regular matrix spraying for lipid and neuropeptide detection from C. borealis brain. Reprinted with permission from ref. Copyright 2009 Elsevier.
Figure 12
Figure 12
High-resolution MALDI images of a mouse cerebellum. The left panel shows the H&E-stained optical image of a mouse brain section. The overlaid phospholipid images show the localization of PC(40:6) (m/z 872 in light blue) to the cerebellar cortex, PC(36:1) and PC(38:4) (m/z 826 in the middle and m/z 810 on the left in red) to the cerebellar nucleus, and PC(38:6) (m/z 844 in green) to the granule cell layer. Reprinted with permission from ref. Copyright 2008 Elsevier.
Figure 13
Figure 13
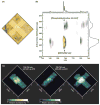
MS Imaging in IMS mode of a nominally isobaric peptide (RPPGFSP) and lipid PC(34:2) deposited onto a mouse liver thin tissue section in the pattern of an X. (A) An optical image of the patterned matrix/analyte spots deposited on the tissue section. (B) A zoomed view in the region of PC(34:2) and RPPGFSP for a representative IMS of a mixture of the two analytes. (C) Extracted ion intensity maps for the peptide (left, green), the lipid (center, blue), and an overlay of the two maps at 50% transparency. Reprinted with permission from ref. Copyright 2007 Wiley Interscience.
Figure 14
Figure 14
IMS diagram of ions detected from a rat brain tissue section covered with DHB. Ions of different drift time but overlapping m/z can be separated from each other. Reprinted with permission from ref. Copyright 2007 Wiley Interscience.
Figure 15
Figure 15
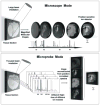
Schematic representation of MS image acquisition process performed in (A) microscope mode and (B) microprobe mode. Reprinted with permission from ref. Copyright 2009 Wiley Interscience.
Figure 16
Figure 16
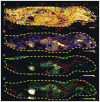
Analysis of a tissue section from an EPPE tumor bearing mouse lung specimen. The photomicrograph of the displayed section, which was H&E-stained following MSI acquisition and matrix removal, shows several histologically different regions: (a) lung, (b) lung tumors (areas in yellow dotted lines), (c) heart, (d) upper respiratory pathways, (e) left heart ventricle, (f) aorta, (g) right pulmonary artery, (h) artery, (i) bronchus. Five distinct ion density maps from proteins which distinctively localize in different areas of the section are displayed. Reprinted with permission from ref. Copyright 2008 American Chemical Society.
Figure 17
Figure 17
MALDI-MS images of peptide distributions within an MCF7 xenograft tissue section. Reprinted with permission from ref. Copyright 2009 Wiley Interscience.
Figure 18
Figure 18
Negative-ion DESI mass spectra of bromophycolides. DESI-MS image (200 μm resolution) of bromophycolide A/B chloride adduct ion m/z 701 on C. serratus surface, indicating that bromophycolide “hot spots” correspond to pale patches. Reprinted with permission from ref. Copyright 2009 PNAS.
Figure 19
Figure 19
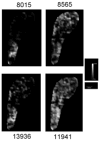
MALDI imaging of proteins from an Anopheles gambiae male antenna. Ion images of four proteins are reported: m/z 8015, m/z 8565, m/z 11941 and m/z 13936 respectively in panel A, B, C, and D, showing a different distribution across the antenna. Reprinted with permission from ref. Copyright 2008 Dani et al.
Figure 20
Figure 20
MALDI images of (A) AMP, (B) ADP, (C) UDP-GlcNac, (D) F-1,6-biP (fructose-1,6-bisphosphate), and (E) GTP (guanosine triphosphate) acquired in the negative ion mode from a rat brain section coated with 9-AA matrix. (F) Optical image of a brain tissue section after 9-AA deposition and analysis by MALDI imaging with a 50 μm pixel size. Reprinted with permission from ref. Copyright 2009 American Chemical Society.
Figure 21
Figure 21
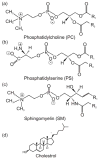
Most common (a,b) glycerophospholipids, (c) sphingolipid and (d) sterol lipid structures.
Figure 22
Figure 22
Imaging of ganglioside distribution in different brain regions. (A) an overview of ganglioside distribution in different brain regions. (B) the distribution pattern of gangliosides in the hippocampus. Reprinted with permission from ref. Copyright 2008 Sugiura et al.
Figure 23
Figure 23
Detection of drug and metabolite distribution in a whole rat sagittal tissue section. (A) Optical image of a 2 h post OLZ (olanzapine) dosed rat tissue section across four gold MALDI target plates. (B) MS/MS ion image of OLZ (m/z 256). (C) MS/MS ion image of N-desmethyl metabolite (m/z 256). (D) MS/MS ion image of 2-hydroxymethyl metabolite (m/z 272). Bar, 1 cm. Reprinted with permission from ref. Copyright 2006 American Chemical Society.
Figure 24
Figure 24
3D reconstruction of images of (a) CabTRP 1a and (b) lipid PC(38:6) acquired from the brain of C. borealis. For images shown in (a), tissue sections were prepared using regular matrix coating method. In contrast, images of (b) were obtained from tissue sections prepared using dry matrix spraying technique that favored detection of lipids. Reprinted with permission from ref. Copyright 2009 Elsevier.

References

    1. Siuzdak G. The Expanding Role of Mass Spectrometry in Biotechnology. MCC Press; San Diego, CA: 2006. p. 11.
    1. Fenn JB, Mann M, Meng CK, Wong SF, Whitehouse CM. Science. 1989;246:64. - PubMed
    1. Karas M, Bachmann D, Hillenkamp F. Anal Chem. 1985;57:2935.
    1. Leinweber BD, Tsaprailis G, Monks TJ, Lau SS. J Am Soc Mass Spectrom. 2009;20:89. - PMC - PubMed
    1. Caprioli RM, Farmer TB, Gile J. Anal Chem. 1997;69:4751. - PubMed

Publication types

MeSH terms