

Influence of socio-economic status on habitual physical activity and sedentary behavior in 8- to 11-year old children
- PMID: 20423487
- PMCID: PMC2873582
- DOI: 10.1186/1471-2458-10-214
Influence of socio-economic status on habitual physical activity and sedentary behavior in 8- to 11-year old children
Abstract
Background: While socio-economic status has been shown to be an important determinant of health and physical activity in adults, results for children and adolescents are less consistent. The purpose of this study, therefore, is to examine whether physical activity and sedentary behavior differs in children by socio-economic status (SES) independent of body mass index.
Methods: Data were from two cohorts including 271 children (117 males; 154 females) in study 1 and 131 children in study 2 (63 males; 68 females). The average age was 9.6 and 8.8 years respectively. Height and body mass were assessed according to standard procedures and body mass index (BMI, kg/m2) was calculated. Parent-reported household income was used to determine SES. Habitual, free-living physical activity (PA) was assessed by a pedometer (steps/day) in study 1 and accelerometer (time spent in moderate-to-vigorous PA) in study 2. Self-reported time spent watching TV and on the computer was used as measure of sedentary behavior. Differences in PA and sedentary behavior by SES were initially tested using ANOVA. Further analyses used ANCOVA controlling for BMI, as well as leg length in the pedometer cohort.
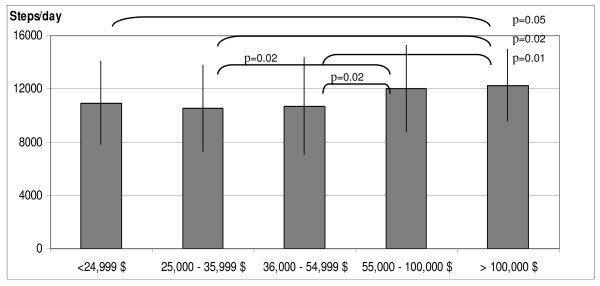
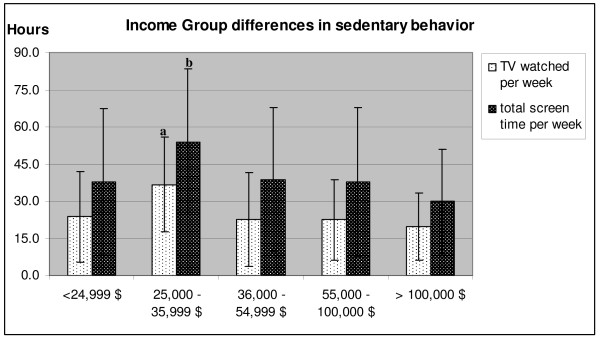
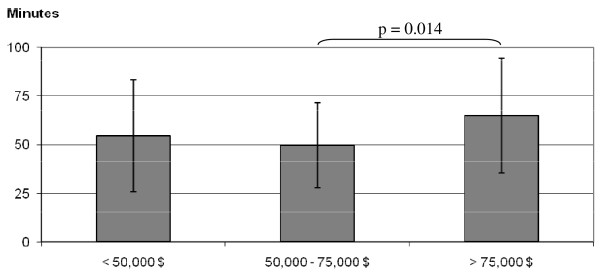
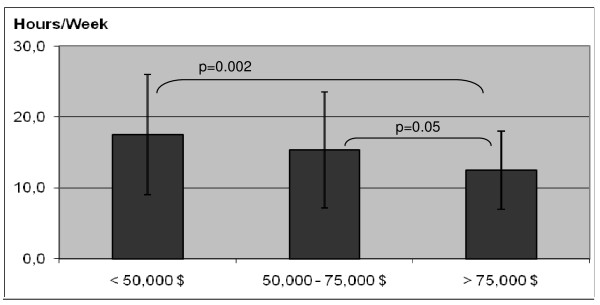
Results: In study 1, mean daily steps differed significantly among SES groups with lower SES groups approximating 10,500 steps/day compared to about 12,000 steps/day in the higher SES groups. These differences remained significant (p < 0.05) when controlling for leg length. Lower SES children, however, had higher body mass and BMI compared to higher SES groups (p < 0.05) and PA no longer remained significant when further controlling for BMI. In study 2 results depended on the methodology used to determine time spent in moderate-to-vigorous physical activity (MVPA). Only one equation resulted in significant group differences (p = 0.015), and these differences remained after controlling for BMI. Significant differences between SES groups were shown for sedentary behavior in both cohorts (P < 0.05) with higher SES groups spending less time watching TV than low SES groups.
Conclusions: Children from a low SES show a trend of lower PA levels and spend more time in sedentary behavior than high SES children; however, differences in PA were influenced by BMI. The higher BMI in these children might be another factor contributing to increased health risks among low SES children compared to children from with a higher SES.
Figures

References
Publication types
MeSH terms
LinkOut - more resources
Full Text Sources
Medical
