

On the sensitivity of ASL MRI in detecting regional differences in cerebral blood flow
- PMID: 20423754
- PMCID: PMC2912434
- DOI: 10.1016/j.mri.2010.03.037
On the sensitivity of ASL MRI in detecting regional differences in cerebral blood flow
Abstract
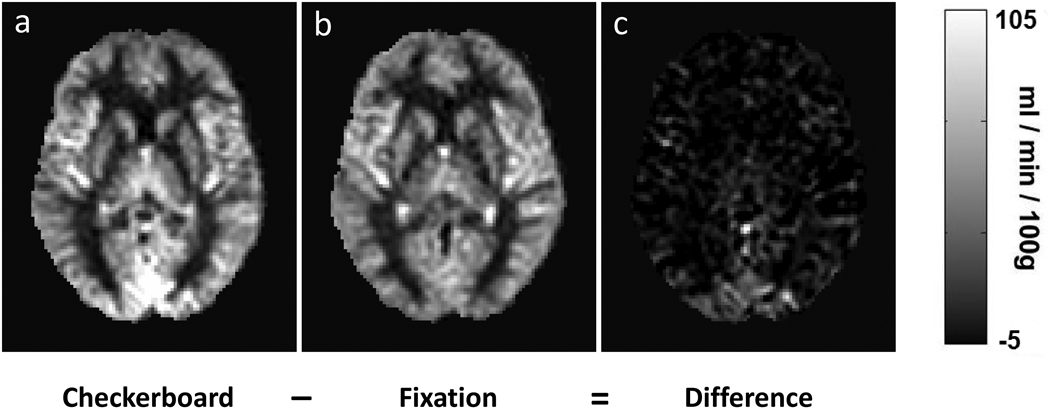
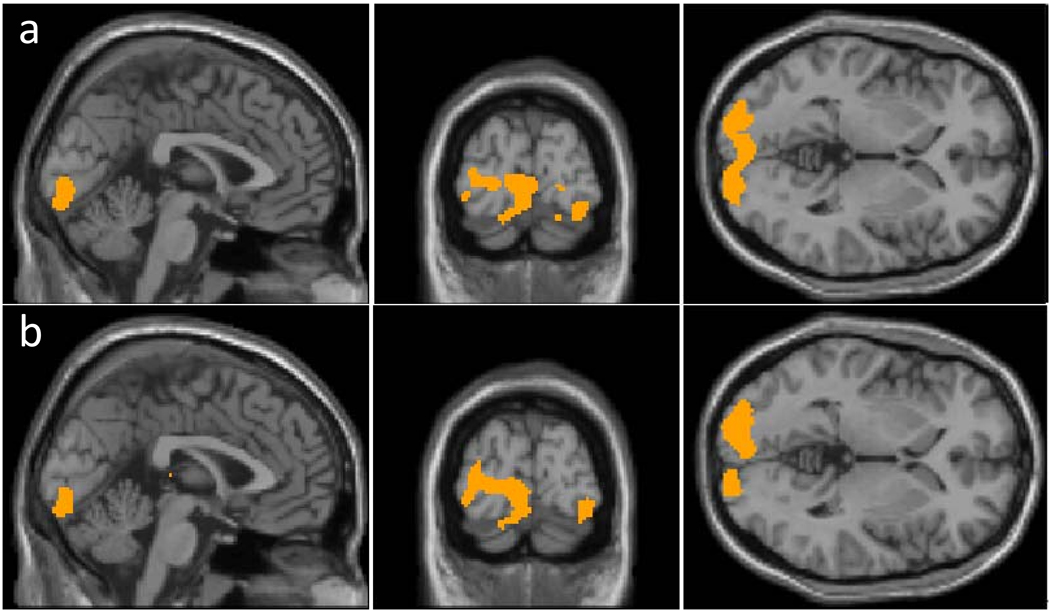
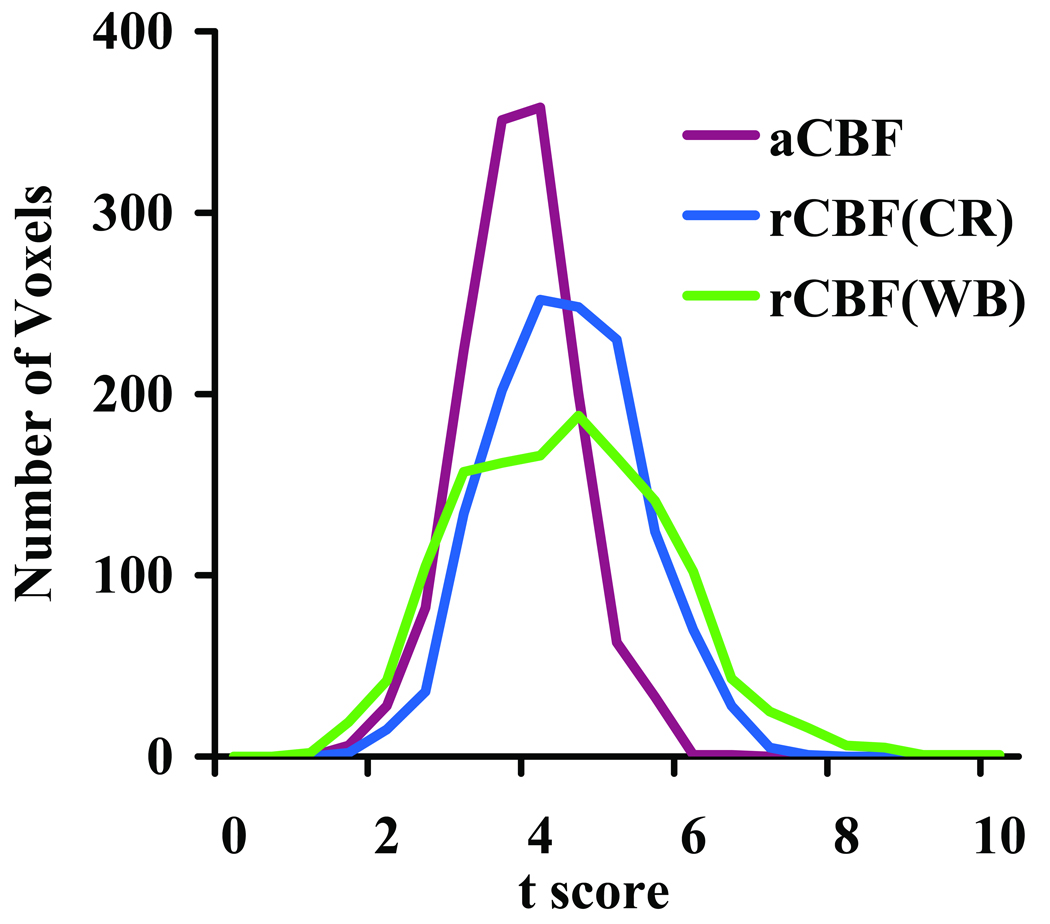
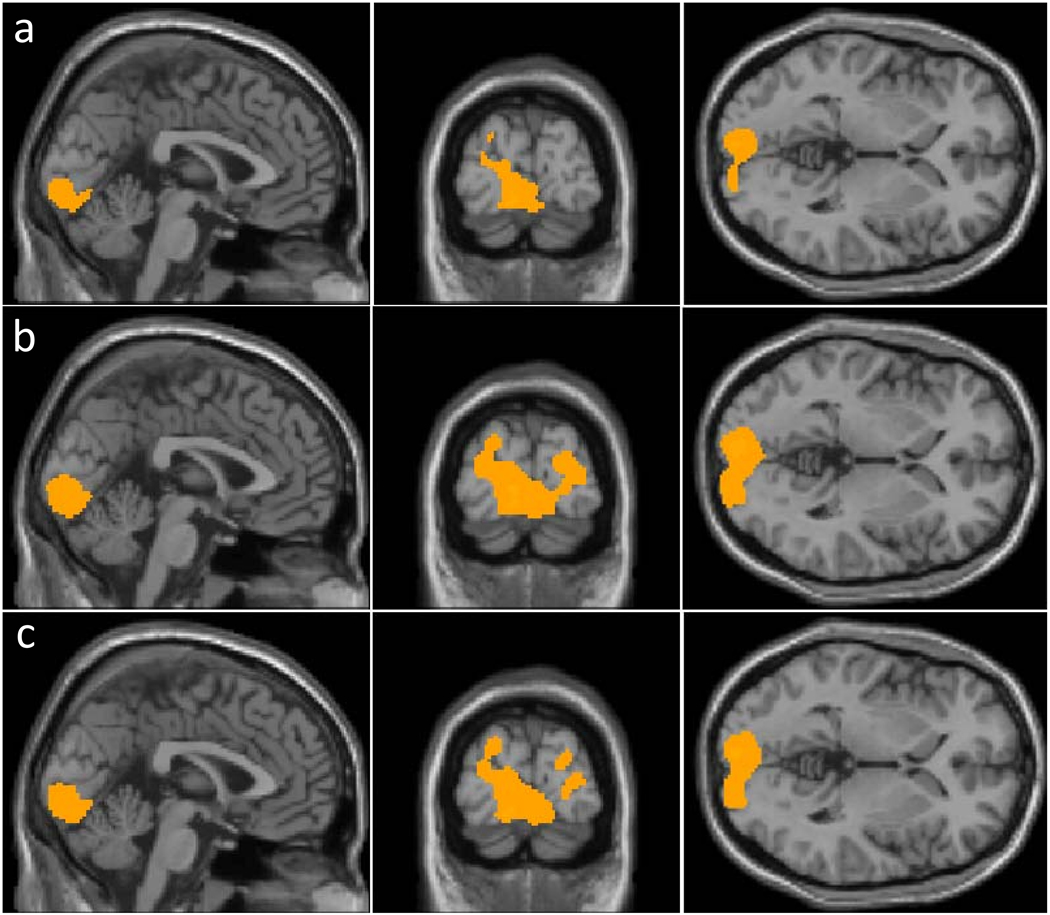
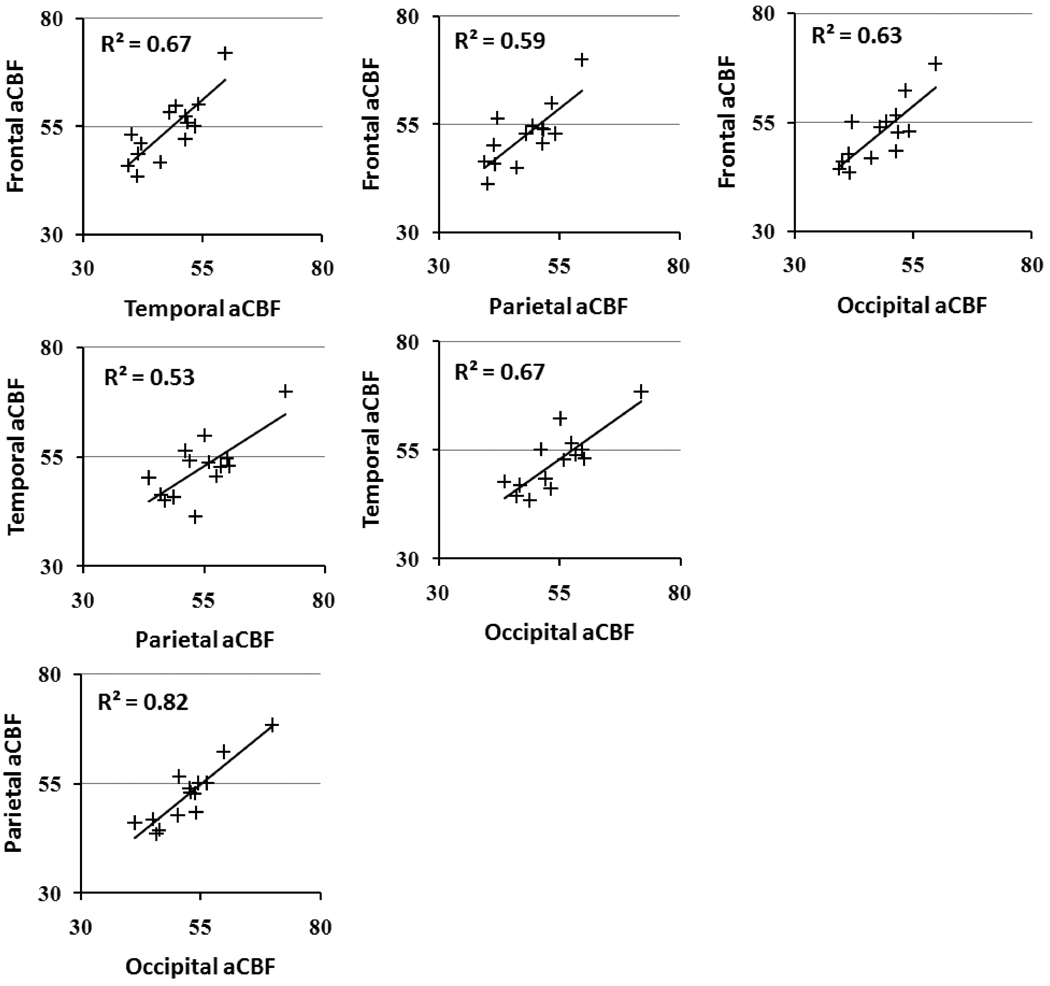
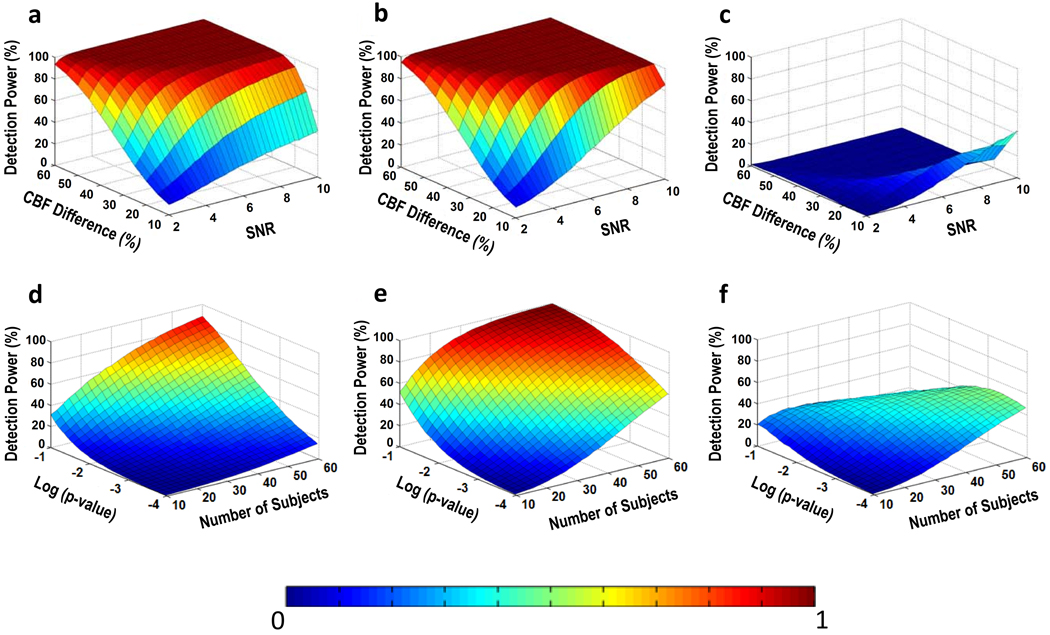
Arterial-spin-labeling (ASL) magnetic resonance imaging (MRI) provides a noninvasive tool to measure cerebral blood flow (CBF) and is increasingly used as a surrogate for baseline neural activity. However, the power of ASL MRI in detecting CBF differences between patient and control subjects is hampered by inter-subject variations in global CBF, which are associated with non-neural factors and may contribute to the noise in the across-group comparison. Here, we investigated the sensitivity of this technique and proposed a normalization strategy to better detect such a difference. A "model" situation was employed in which two visual stimuli (i.e. cross fixation and flashing checkerboard) were presented to two groups of subjects to mimic "control" and "patient" groups (N=7 for each group), respectively. It was found that absolute CBF (aCBF) in the occipital lobe in the checkerboard group was 26.0% greater compared to the fixation group, but the level of significance was modest (P=.03). In contrast, when normalizing the CBF with whole-brain CBF or CBF in a reference region [termed relative CBF (rCBF)], the statistical significance was improved considerably (P<.003). For voxel-based analysis, the rCBF indices correctly detected CBF differences in the occipital lobe in the across-group comparison, while aCBF failed to detect any significant cluster using the same statistical threshold. We also performed Monte Carlo simulation to confirm the experimental findings and found that the power improvement was most pronounced when signal-to-noise-ratio is moderate and the underlying CBF difference was small. The simulation also showed that, with the proposed normalization, a detection power of 80% can be achieved using a sample size of about 20. In summary, rCBF is a more sensitive index to detect small differences in CBF, rather than the much-sought-after aCBF, since it reduces data noise caused by inter-subject variations in global CBF.
Figures
References
-
- Carrera E, Maeder-Ingvar M, Rossetti AO, Devuyst G, Bogousslavsky J. Trends in risk factors, patterns and causes in hospitalized strokes over 25 years: The Lausanne Stroke Registry. Cerebrovasc Dis. 2007;24(1):97–103. - PubMed
-
- Weiss JS, Sumpio BE. Review of prevalence and outcome of vascular disease in patients with diabetes mellitus. Eur J Vasc Endovasc Surg. 2006;31(2):143–150. - PubMed
-
- Nagata K, Maruya H, Yuya H, Terashi H, Mito Y, Kato H, Sato M, Satoh Y, Watahiki Y, Hirata Y, Yokoyama E, Hatazawa J. Can PET data differentiate Alzheimer's disease from vascular dementia? Ann N Y Acad Sci. 2000;903:252–261. - PubMed
Publication types
MeSH terms
Substances
Grants and funding
LinkOut - more resources
Full Text Sources
Medical
