. 2010 Jun;61(10):2647-68.
doi: 10.1093/jxb/erq104. Epub 2010 Apr 27.

Genome-wide identification, classification, and expression analysis of the arabinogalactan protein gene family in rice (Oryza sativa L.)

Affiliations

Genome-wide identification, classification, and expression analysis of the arabinogalactan protein gene family in rice (Oryza sativa L.)

Haoli Ma et al. J Exp Bot. 2010 Jun.

Abstract

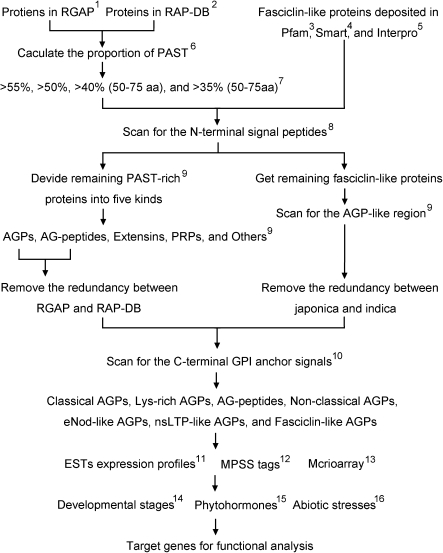
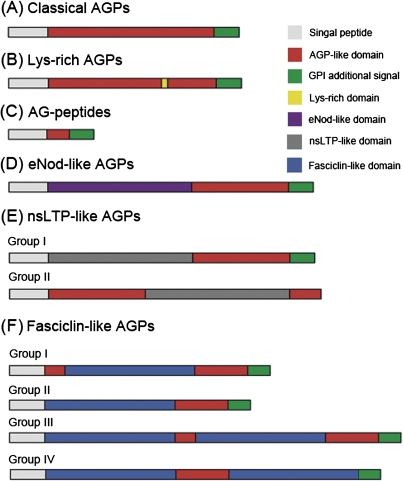
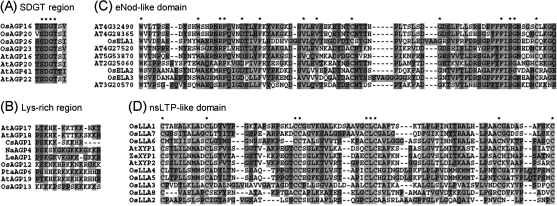
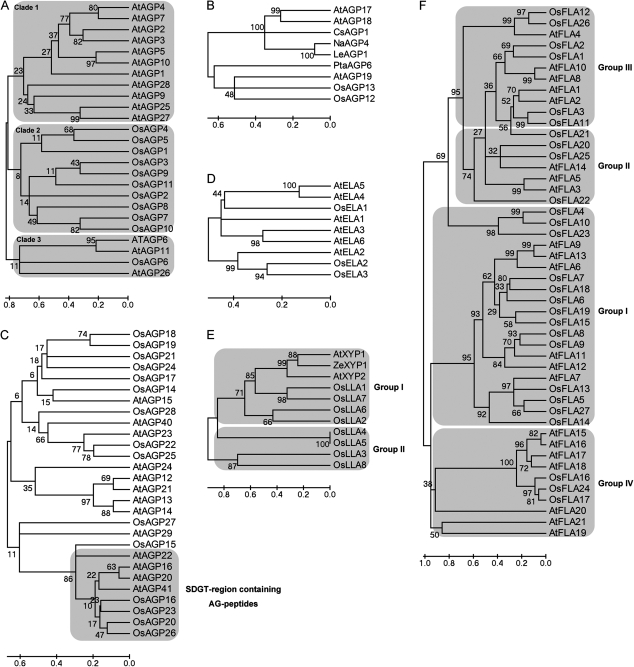
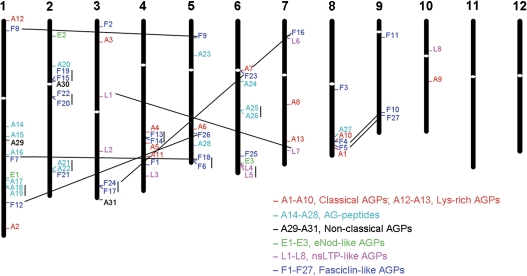
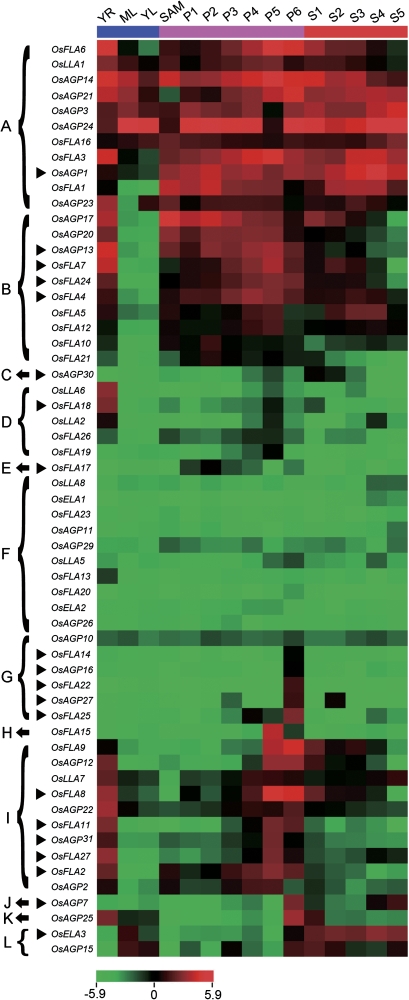
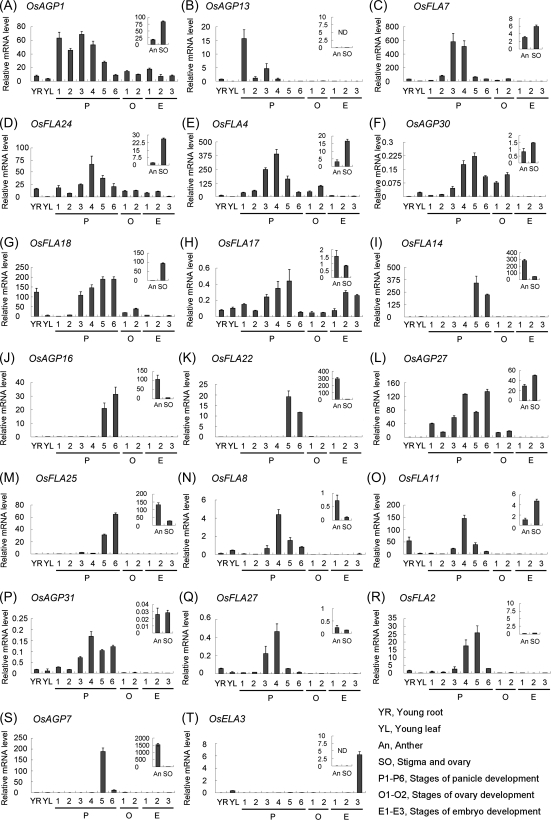
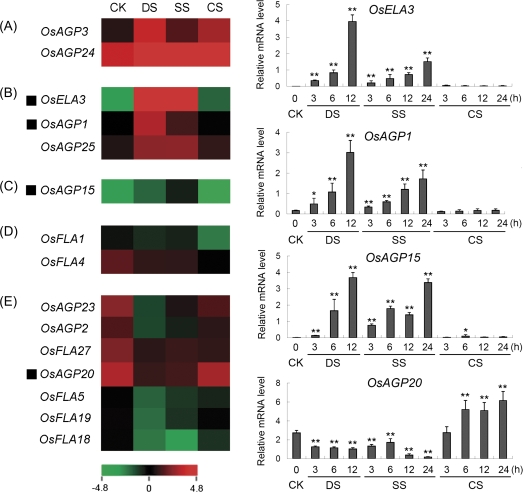
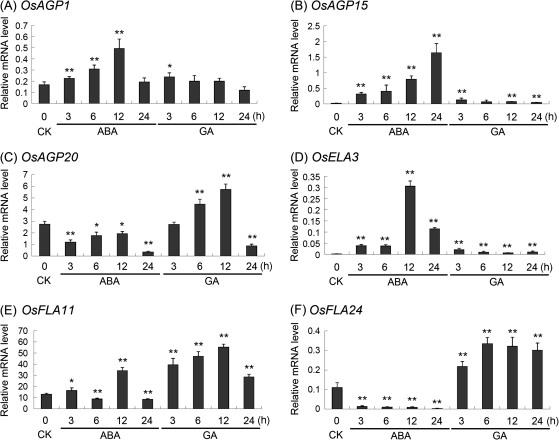
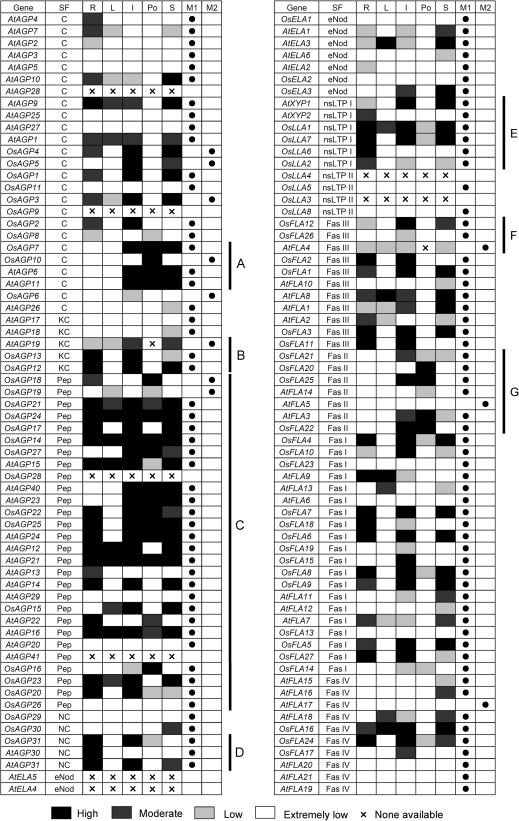
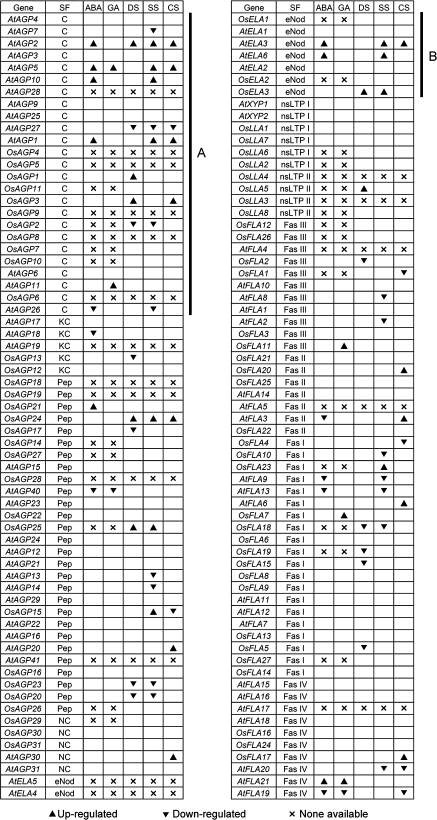
Arabinogalactan proteins (AGPs) comprise a family of hydroxyproline-rich glycoproteins that are implicated in plant growth and development. In this study, 69 AGPs are identified from the rice genome, including 13 classical AGPs, 15 arabinogalactan (AG) peptides, three non-classical AGPs, three early nodulin-like AGPs (eNod-like AGPs), eight non-specific lipid transfer protein-like AGPs (nsLTP-like AGPs), and 27 fasciclin-like AGPs (FLAs). The results from expressed sequence tags, microarrays, and massively parallel signature sequencing tags are used to analyse the expression of AGP-encoding genes, which is confirmed by real-time PCR. The results reveal that several rice AGP-encoding genes are predominantly expressed in anthers and display differential expression patterns in response to abscisic acid, gibberellic acid, and abiotic stresses. Based on the results obtained from this analysis, an attempt has been made to link the protein structures and expression patterns of rice AGP-encoding genes to their functions. Taken together, the genome-wide identification and expression analysis of the rice AGP gene family might facilitate further functional studies of rice AGPs.


Figures

Fig. 1.
Fig. 1.
The workflow and parameters of AGP identification and data mining. 1, RGAP, Rice Genome Annotation Project; 2, RAP-DB, Rice Annotation Project Database; 3, PF02469 at http://pfam.sanger.ac.uk/; 4, SM00554 at http://smart.embl-heidelberg.de/; 5, IPR000782 at http://www.ebi.ac.uk/interpro/; 6, run a Perl script that divides proteins into several parts according to their amino acid composition; 7, aa, the length of candidate proteins in amino acids; 8, signal peptide prediction, http://www.cbs.dtu.dk/services/SignalP/; 9, the criteria to separate different kinds of HRGPs are detailed in Materials and methods; 10, GPI anchor signal prediction, http://mendel.imp.ac.at/gpi/plant_server.html; 11, EST expression profiles from UniGene at http://www.ncbi.nlm.nih.gov/unigene/; 12, MPSS tags, http://mpss.udel.edu/rice/; 13, the absolute signal values were downloaded at http://signal.salk.edu/cgi-bin/RiceGE; 14, GSE6893, expression at various developmental stages; 15, GSE661, expression under ABA and GA treatments; 16, GSE6901, expression under abiotic stresses treatments.
Fig. 2.
Fig. 2.
Schematic representations of the different subclasses of rice AGP protein backbones. Not drawn to scale
Fig. 3.
Fig. 3.
Multiple sequence alignments of the SDGT region (A), Lys-rich region (B), eNod-like domain (C), and nsLTP-like domain (D).
Fig. 4.
Fig. 4.
Phylogenetic relationship of AGPs between rice and other species. (A) Classical AGPs, (B) Lys-rich AGPs, (C) AG peptides, (D) eNod-like AGPs, (E) nsLTP-like AGPs, and (F) fasciclin-like AGPs. The phylogenetic tree is based on the multiple sequence alignments of AGPs and was generated using MEGA 4.0 by the Neighbor–Joining method. Bootstrap support from 10 000 reiterations is indicated above the branches.
Fig. 5.
Fig. 5.
Genomic localization of AGP-encoding genes on rice chromosomes. AGP-encoding genes classified into different subfamilies are shown in different colours. White ovals on the chromosomes indicate the position of centromeres. Chromosome numbers are indicated at the top of each chromosome. The AGP-encoding genes presented on duplicated chromosomal segments between two chromosomes are connected by black lines, and tandem duplicated genes on the same chromosome are connected by a vertical bar.
Fig. 6.
Fig. 6.
Expression profiles of AGP-encoding genes in various rice organs and tissues at different development stages. The microarray data sets (GSE6893) of gene expression at various developmental stages were used for cluster display. A heat map representing hierarchical clustering of average log signal values of all the AGP-encoding genes in various organs and tissues at different developmental stages (indicated at the top of each lane). The genes which share similar expression patterns are divided into 12 clusters: (A) all examined tissues; (B) all examined tissues except ML and YL; (C) S1 and S2; (D) YR and P5; (E) P3; (F) low expression in all examined tissues; (G) P6; (H) P5; (I) YR, P5, and P6; (J) P6, S4, and S5; (K) YR, P6, and S1; (L) YL, ML, P6, and S1–S6. The representative AGP-encoding genes differentially expressed during various stages of development for which real-time PCR analysis was performed are indicated by a black triangle on the left. The colour scale (representing average log signal values) is shown at the bottom.
Fig. 7.
Fig. 7.
Real-time PCR analysis for confirmation of the differential expression of representative AGP-encoding genes in various organs and tissues at different development stages. The small pictures inserted in the figures represent their relative expression levels in anther (An) and stigma and ovary (SO) from 28 cm panicles.
Fig. 8.
Fig. 8.
Expression profiles of rice AGP-encoding genes differentially expressed under abiotic stresses. The microarray data sets (GSE6901) of gene expression under various abiotic stresses were used for cluster display. The average log signal values of AGP-encoding genes under control and various stress conditions (indicated at the top of each lane) are presented by a heat map. Only those genes that exhibited ≥2-fold differential expression, under any of the given abiotic stress conditions, are shown. (A) Up-regulated by drought, salt, and cold stresses; (B) up-regulated by drought and salt stresses; (C) up-regulated by salt stress; (D) down-regulated by cold stress; (E) down-regulated by drought and salt stresses. The representative AGP-encoding genes differentially expressed under different abiotic stress conditions for which real-time PCR analysis was performed are indicated as a black triangle to the left. The results of real-time PCR analysis for confirmation of the differential expression of rice AGP-encoding genes under abiotic stresses are shown on the right. Two asterisks (**, P <0.01) and one asterisk (*, 0.01<P < 0.05) represent significant differences between the controls and treatments as determined by Origin 7.5. The mRNA levels for each candidate gene in different organ and tissue samples were calculated relative to its expression in control seedlings. The colour scale (representing average log signal values) is shown at the bottom. CK, control; DS, drought stress; SS, salt stress; CS, cold stress.
Fig. 9.
Fig. 9.
Real-time PCR analysis for confirmation of the differential expression of rice AGP-encoding genes under ABA and GA treatments. Two asterisks (**, P <0.01) and one asterisk (*, 0.01<P < 0.05) represent significant differences between the controls and treatments as determined by Origin 7.5. CK, control.
Fig. 10.
Fig. 10.
The expression patterns in different tissues for Arabidopsis and rice AGP-encoding genes. AGP-encoding genes are presented in the same order as in the corresponding phylogenetic trees. The expression data of AGP-encoding genes in different tissues were combined from microarrays and MPSS tags. The expression data in pollen of rice AGP-encoding genes were extracted from MPSS tags. Letters on the top indicate different tissues and databases. M1 and M2 represent microarrays and MPSS tags, respectively. The ratios of the absolute values divided by the average of all microarray values were used for analysis (Supplementary Table S5 at JXB online). Light grey, dark grey, and black boxes indicate low (between 0.5 and 1 or the signature numbers between 0 tpm and 50 tpm), moderate (between 1 and 2 or between 50 tpm and 500 tpm), and high (>2 or >500 tpm) expression levels, respectively. The white boxes indicate that no expression could be detected (<0.5). ‘×’ represents no probe or signature on microarray and MPSS. SF, subfamily; R, root; L, leaf; I, inflorescence; Po, pollen; S, silique or seed.
Fig. 11.
Fig. 11.
The expression patterns under ABA, GA, and abiotic stress treatments for Arabidopsis and rice AGP-encoding genes. AGP-encoding genes are presented in the same order as in the corresponding phylogenetic trees. The expression data of AGP-encoding genes under ABA, GA, drought stress, salt stress, and cold stress treatments were from microarrays. Upright triangles and inverted triangle represent values that are significantly lower (<0.5) and higher (>2) than the control, and ‘×’ represents no probe on microarray. SF, subfamily; DS, drought stress; SS, salt stress; CS, cold stress.

References

    1. Albert M, Belastegui-Macadam X, Kaldenhoff R. An attack of the plant parasite Cuscuta reflexa induces the expression of attAGP, an attachment protein of the host tomato. The Plant Journal. 2006;48:548–556. - PubMed
    1. Acosta-Garcia G, Vielle-Calzada JP. A classical arabinogalactan protein is essential for the initiation of female gametogenesis in. Arabidopsis. The Plant Cell. 2004;16:2614–2628. - PMC - PubMed
    1. Anand S, Tyagi AK. Characterization of a pollen-preferential gene OSIAGP from rice (Oryza sativa L. subspecies indica) coding for an arabinogalactan protein homologue, and analysis of its promoter activity during pollen development and pollen tube growth. Transgenic Research. 2009 (in press) - PubMed
    1. Borner GH, Lilley KS, Stevens TJ, Dupree P. Identification of glycosylphosphatidylinositol-anchored proteins in arabidopsis. A proteomic and genomic analysis. Plant Physiology. 2003;132:568–577. - PMC - PubMed
    1. Brenner S, Johnson M, Bridgham J, et al. Gene expression analysis by massively parallel signature sequencing (MPSS) on microbead arrays. Nature Biotechnology. 2000;18:630–634. - PubMed

Publication types

MeSH terms