. 2010 Apr;22(4):1216-31.
doi: 10.1105/tpc.110.074088. Epub 2010 Apr 27.

Sulfite reductase defines a newly discovered bottleneck for assimilatory sulfate reduction and is essential for growth and development in Arabidopsis thaliana

Affiliations

Sulfite reductase defines a newly discovered bottleneck for assimilatory sulfate reduction and is essential for growth and development in Arabidopsis thaliana

Muhammad Sayyar Khan et al. Plant Cell. 2010 Apr.

Abstract

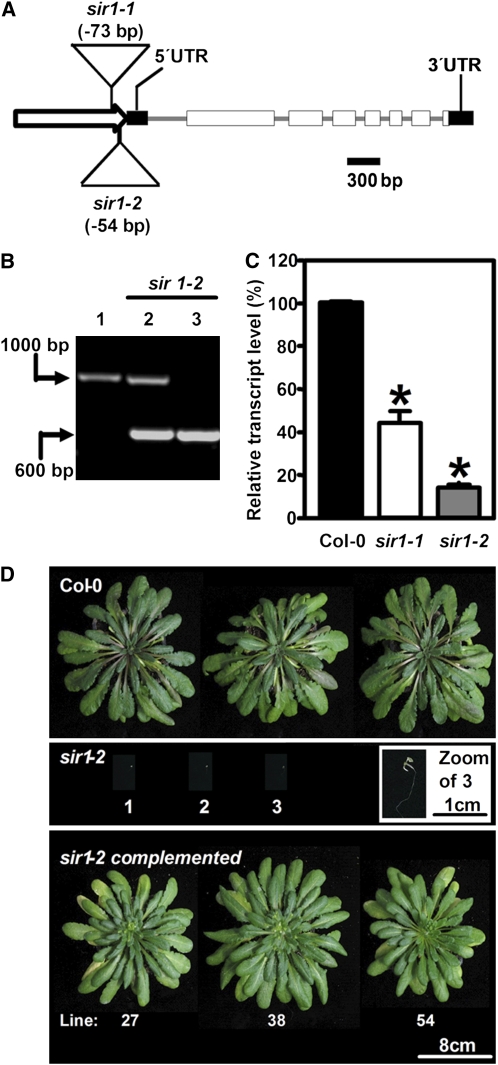
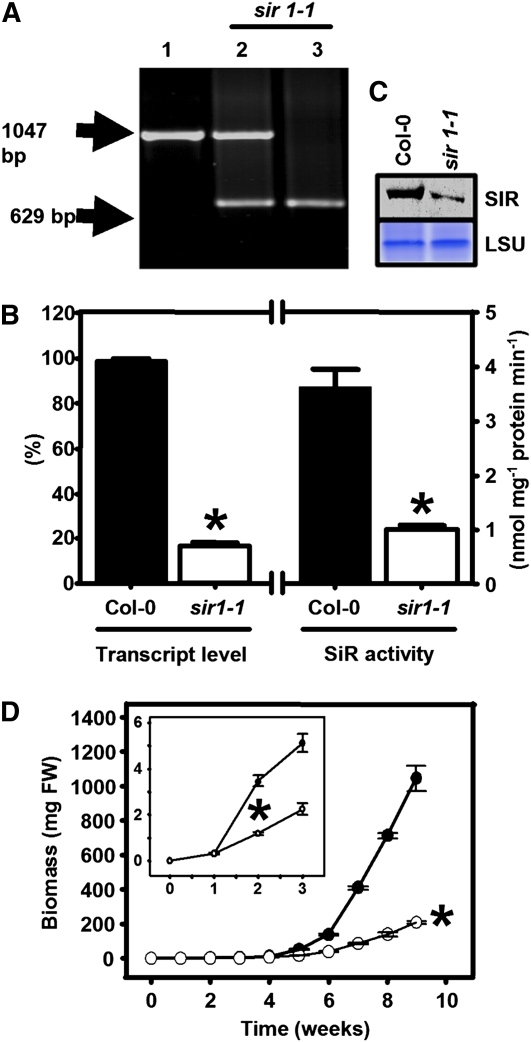
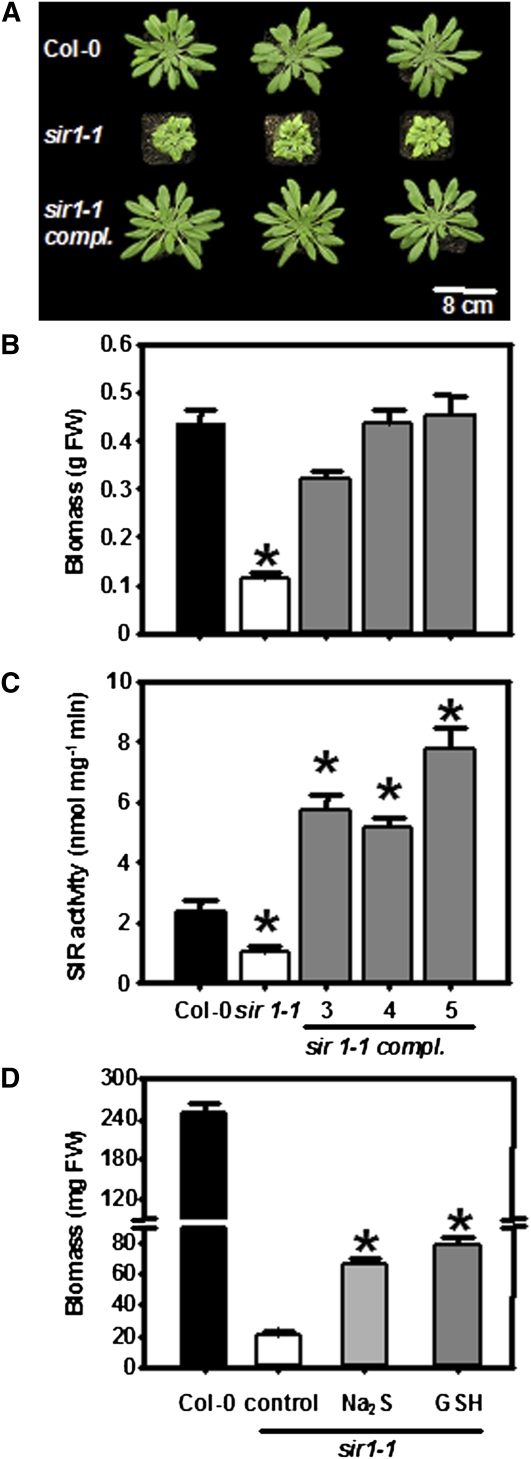
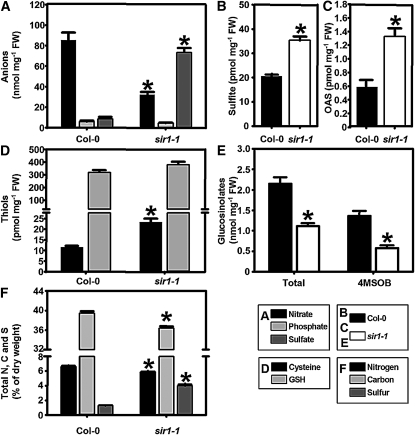
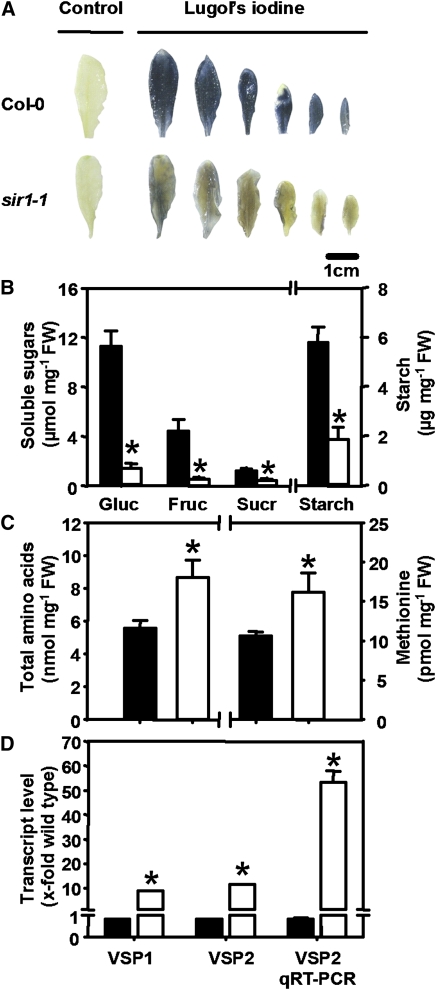
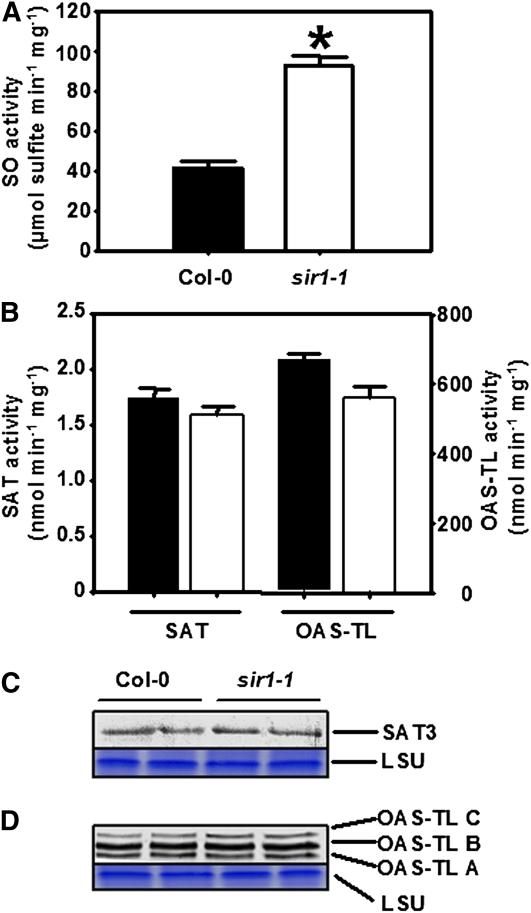
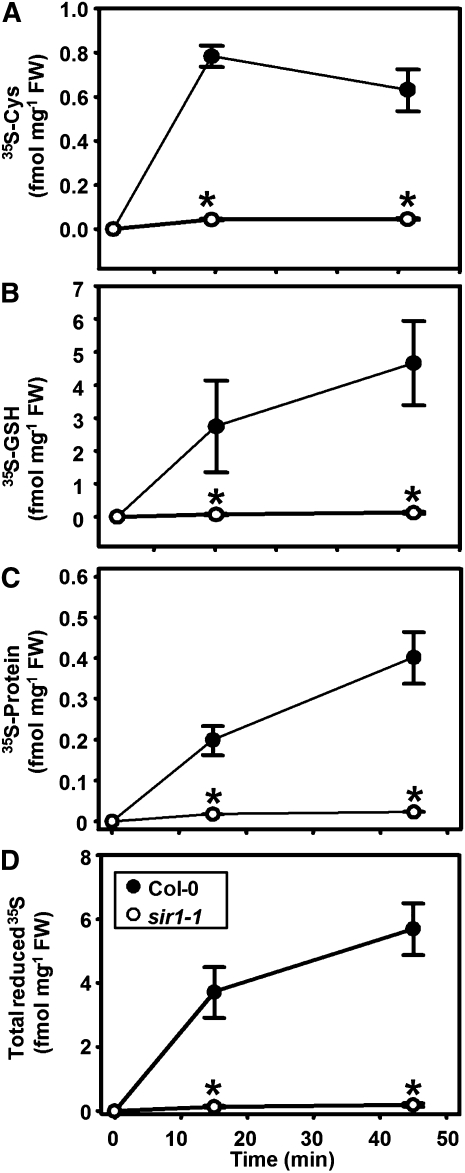
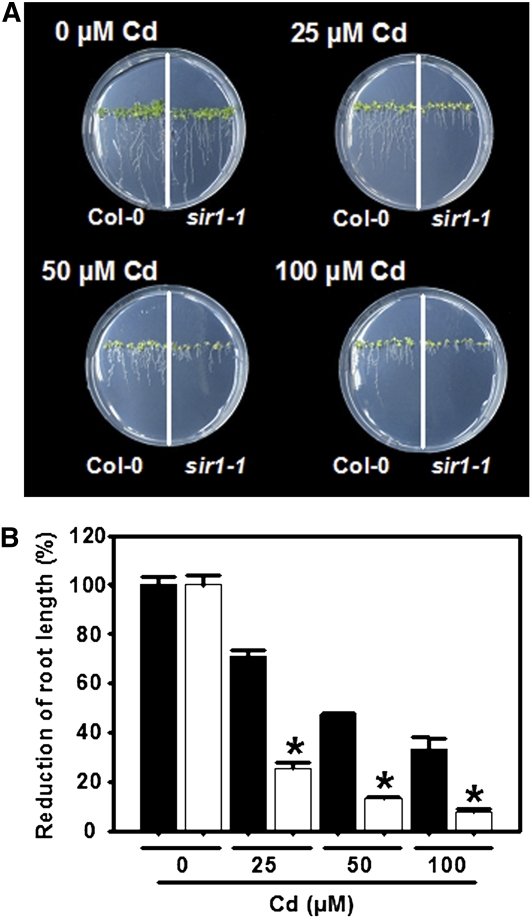
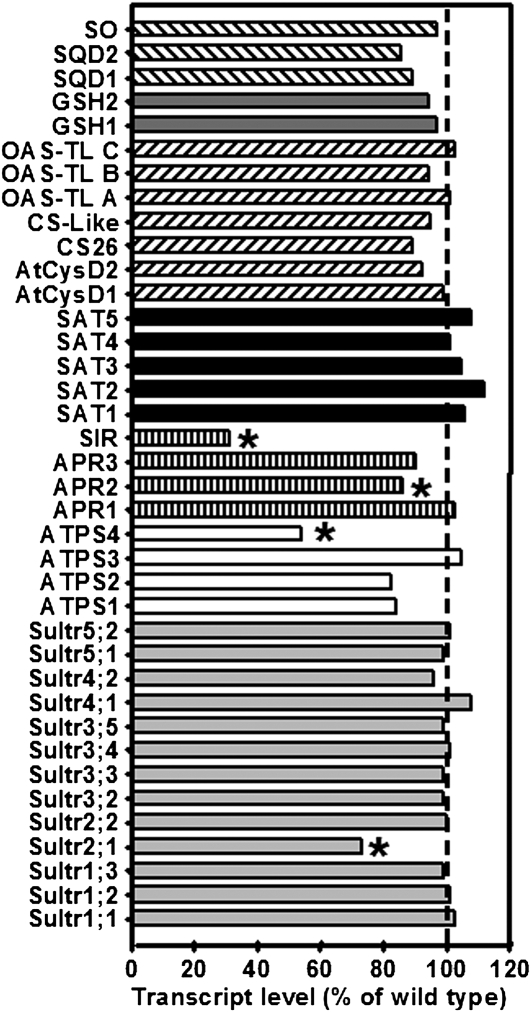
The role of sulfite reductase (SiR) in assimilatory reduction of inorganic sulfate to sulfide has long been regarded as insignificant for control of flux in this pathway. Two independent Arabidopsis thaliana T-DNA insertion lines (sir1-1 and sir1-2), each with an insertion in the promoter region of SiR, were isolated. sir1-2 seedlings had 14% SiR transcript levels compared with the wild type and were early seedling lethal. sir1-1 seedlings had 44% SiR transcript levels and were viable but strongly retarded in growth. In mature leaves of sir1-1 plants, the levels of SiR transcript, protein, and enzymatic activity ranged between 17 and 28% compared with the wild type. The 28-fold decrease of incorporation of (35)S label into Cys, glutathione, and protein in sir1-1 showed that the decreased activity of SiR generated a severe bottleneck in the assimilatory sulfate reduction pathway. Root sulfate uptake was strongly enhanced, and steady state levels of most of the sulfur-related metabolites, as well as the expression of many primary metabolism genes, were changed in leaves of sir1-1. Hexose and starch contents were decreased, while free amino acids increased. Inorganic carbon, nitrogen, and sulfur composition was also severely altered, demonstrating strong perturbations in metabolism that differed markedly from known sulfate deficiency responses. The results support that SiR is the only gene with this function in the Arabidopsis genome, that optimal activity of SiR is essential for normal growth, and that its downregulation causes severe adaptive reactions of primary and secondary metabolism.


Figures

Figure 1.
Figure 1.
Molecular Identification of sir Mutants and Phenotype of sir1-2. (A) Structure of the SiR locus with the T-DNA insertion sites in sir1-1 and sir1-2. The putative promoter is marked by a white arrow, exons are indicated as white boxes, and untranslated regions by black boxes. (B) Genomic characterization of sir1-2 plants. Wild-type (1), heterozygous (2), and homozygous (3) sir1-2 plants were tested for the presence of wild-type and T-DNA insertion alleles of SiR by PCR. (C) Transcript levels of SiR in the wild type, sir1-1, and sir1-2 determined by qRT-PCR at the developmental stage of five to six leaves of the wild type. The homozygous sir1-2 plants arrested at the two cotyledon stage. Bars represent the mean of pooled individuals (n = 6), while error bars show standard errors of technical replicates (n = 3). Asterisks indicate statistically significant (P < 0.05) differences from wild-type values. (D) Growth phenotype and genetic complementation of sir1-2. For genetic complementation, the cDNA of SiR was fused with the 35S promoter and introduced in sir1-1 plants by Agrobacterium tumefaciens–mediated transformation. [See online article for color version of this figure.]
Figure 2.
Figure 2.
Abundance and Activity of SiR in the T-DNA Insertion Line sir1-1. (A) Genomic characterization of sir1-1 plants. Wild-type (1), heterozygous (2), and homozygous (3) sir1-1 plants were tested for the presence of wild-type and T-DNA insertion alleles of SiR by PCR. (B) Determination of SiR activity (n = 5, mean ± se) and relative SiR transcript levels by qRT-PCR (n = 3, mean ± se) in leaves of 7-week-old plants. Amplification of Ef1α from the same cDNA preparations was used as a control for qRT-PCR. (C) Immunoblot of soluble leaf proteins from wild-type and sir1-1 plants was performed with a polyclonal antibody against SiR from Arabidopsis. Staining intensities of the large subunit of ribulose-1,5-bisphosphate carboxylase/oxygenase (LSU) in the same sample confirms equal loading. (D) Growth curve of wild-type (black circles) and sir1-1 plants (white circles). Growth retardation of sir1-1 was statistically significant from week 2 on, as detailed in the inset. All plants were grown on soil in a growth chamber under short-day conditions (n = 5). Means ± se are shown. Asterisks indicate statistically significant (P < 0.05) differences from wild-type values. [See online article for color version of this figure.]
Figure 3.
Figure 3.
Phenotype and Complementation of sir1-1 Plants. (A) Top view of 7-week-old wild-type, sir1-1, and genetically complemented sir1-1 plants. Genetic complementation of sir1-1 was achieved by transformation of the wild-type SiR gene under control of the 35S promoter from the Cauliflower mosaic virus. (B) Fresh weight of 7-week-old wild type (black), sir1-1 (white), and three complemented sir1-1 lines (gray) grown on soil under short-day conditions (n = 5). (C) Specific activity of SiR in extracts from leaves shown in (B) (n = 5). (D) FW of 6-week-old hydroponically grown wild-type (black), sir1-1 (white), and sir1-1 plants that were supplemented with 0.1 mM sodium sulfide (gray) and 1 mM GSH (dark gray) in the growth medium (n = 5). Means ± se are shown. Asterisks indicate statistically significant (P < 0.05) differences from wild-type values.
Figure 4.
Figure 4.
Impact of Reduced SiR Activity on Metabolism in Leaves of sir1-1 Plants. (A) to (D) Metabolites were extracted from 7-week-old wild-type and sir1-1 plants and quantified by HPLC (n = 5). (E) Total glucosinolates were extracted and quantified from the same samples (4MSOB, glucoraphanin, n = 10). Other glucosinolates are shown in Supplemental Figure 2 online. (F) Aerial parts of 8-week-old wild-type and sir1-1 plants (n = 10) were used to determine the total content of nitrogen (black), carbon (gray), and sulfur (dark gray) twice for each sample. All plants were grown on soil under short-day conditions. Means ± se are shown. Asterisks indicate statistically significant (P < 0.05) differences from wild-type values.
Figure 5.
Figure 5.
Deregulation of Carbon- and Reduced Nitrogen-Containing Compounds in sir1-1 Plants. (A) Starch (blue) was determined using Lugol's iodine staining. Leaves after ethanol treatment but without Lugol staining are shown as control. (B) and (C) Quantification of amino acids (n = 5), glucose (Gluc), fructose (Fruc) sucrose (Sucr), and starch (mean ± se; n = 3) after extraction from leaves of wild-type (black) and sir1-1 (white) plants. (D) Transcript levels of VSP1 and VSP2 in leaves of wild-type (black) and sir1-1 (white) plants were determined by microarray hybridization (VSP1 and VSP2, n = 12) and qRT-PCR (VSP2 qRT-PCR, n = 3). In all cases, material was harvested from wild-type and sir1-1 plants that were grown for 7 to 8 weeks on soil under short-day conditions. Asterisks indicate statistically significant (P < 0.05) differences from wild-type values. [See online article for color version of this figure.]
Figure 6.
Figure 6.
Abundance and Activity of SO, SAT, and OAS-TL in Leaves of sir1-1 Plants. (A) Specific activity of SO in protein extracts of 7-week-old wild-type (black) and sir1-1 (white) plants that were grown on soil under short-day conditions. (B) Specific activity of SAT and OAS-TL from the same extracts as in (A). The specific activities of SO, SAT, and OAS-TL were determined for each extract in triplicates with varying amounts of proteins to prove time and protein linearity of measurement (n = 5 to 7). Means ± se are shown. The asterisk indicates a statistically significant (P < 0.05) difference from the wild-type value. (C) An immunoblot loaded with soluble protein from two extractions each of the leaves from the wild type and sir1-1 was decorated with At-SAT3 polyclonal antiserum. (D) Same experimental set up as in (C), but a polyclonal antiserum against At-OAS-TLC was used, which also detects At-OAS-TL A and B. Staining of the large subunit of ribulose-1,5-bisphosphate carboxylase/oxygenase (LSU) with Coomassie blue was used to confirm equal loading of lanes. [See online article for color version of this figure.]
Figure 7.
Figure 7.
Incorporation Rates of Sulfate in Wild-Type and sir1-1 Plants. (A) to (C) Leaf pieces of 7-week-old wild-type (black circles) and sir1-1 (white circles) plants, which were grown hydroponically under short-day conditions, were incubated with 35SO42--spiked half-strength Hoagland solution for 15 min (pulse, beginning at time 0) and subsequently kept in the same medium without radiolabel for 30 min (chase). Cys (A), GSH (B), and proteins (C) were extracted and separated by HPLC or specific precipitation. The incorporated 35S label was quantified by scintillation counting. (D) Total sum of incorporated 35S label in Cys, GSH and proteins. The mean ± se from four independent extractions of the wild type and sir1-1 are shown. Asterisks indicate statistically significant (P < 0.05) differences from wild-type values.
Figure 8.
Figure 8.
Cadmium Sensitivity of sir1-1 Plants. (A) Top views of wild-type (Col-0, left) and sir 1-1 (right side) plants grown for 15 d on At-medium supplemented with varying concentrations of cadmium (0 to 0.1 mM CdCl2). (B) Quantification of root growth of wild-type (black) and sir1-1 (white) plants grown as in (A). To allow comparison between wild-type and sir1-1 plants, the root growth is shown as percentage of growth of the respective line under nonstress conditions. Mean ± se are shown (n = 6 to 10). Asterisks indicate statistically significant (P < 0.05) differences from wild-type plants grown at the same concentration of Cd. [See online article for color version of this figure.]
Figure 9.
Figure 9.
Transcript Levels of Sulfur Metabolism-Related Genes in Leaves of sir1-1 Plants. The transcript levels of sulfur metabolism related genes in leaves of sir1-1 and wild-type plants (Col-0) grown on soil under short-day conditions for 7 weeks were compared using a targeted microarray approach. Total mRNA was extracted from three individuals of each plant line, labeled independently two times with Cy3 and Cy5, and cohybridized with the microarray twice (n = 12). From bottom to top: The transcript levels of genes encoding sulfate transporters (light-gray bars), ATPS (white bars), sulfate-reducing enzymes (striped bars), SATs (black bars), OAS-TLs (inclined dashed bars), proteins participating in GSH synthesis (dark gray bars), and sulfolipid biosynthesis enzymes (declined dashed bars) in sir1-1 plants are shown as percentage of wild-type levels. Asterisks indicate statistically significant (P < 0.05) differences from wild-type expression levels of the same gene.

References

    1. Benjamini Y., Hochberg Y. (1995). Controlling the false discovery rate: A practical and powerful approach to multiple testing. J. R. Stat. Soc., B 57: 289–300
    1. Benning C. (2007). Questions remaining in sulfolipid biosynthesis: A historical perspective. Photosynth. Res. 92: 199–203 - PubMed
    1. Blake-Kalff M.M., Harrison K.R., Hawkesford M.J., Zhao F.J., McGrath S.P. (1998). Distribution of sulfur within oilseed rape leaves in response to sulfur deficiency during vegetative growth. Plant Physiol. 118: 1337–1344 - PMC - PubMed
    1. Bork C., Schwenn J.D., Hell R. (1998). Isolation and characterization of a gene for assimilatory sulfite reductase from Arabidopsis thaliana. Gene 212: 147–153 - PubMed
    1. Bradford M.M. (1976). A rapid and sensitive method for the quantitation of microgram quantities of protein utilizing the principle of protein-dye binding. Anal. Biochem. 72: 248–254 - PubMed

Publication types

MeSH terms

Associated data