. 2010 May;120(5):1561-9.
doi: 10.1172/JCI40266. Epub 2010 Apr 26.

Cooperation between the transcription factors p63 and IRF6 is essential to prevent cleft palate in mice

Affiliations

Cooperation between the transcription factors p63 and IRF6 is essential to prevent cleft palate in mice

Helen A Thomason et al. J Clin Invest. 2010 May.

Abstract

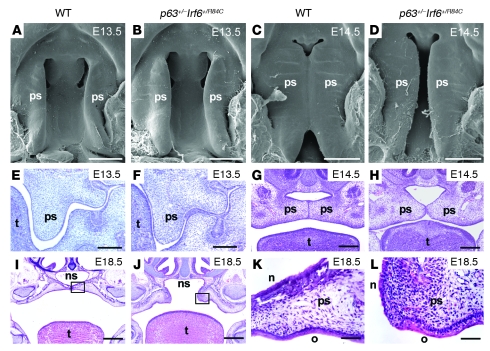
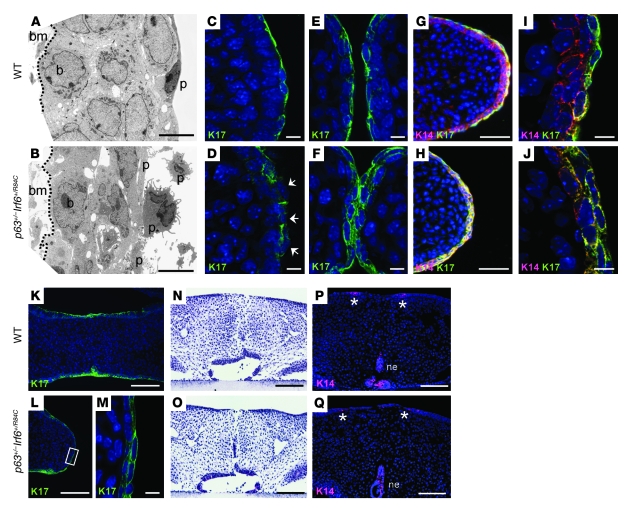
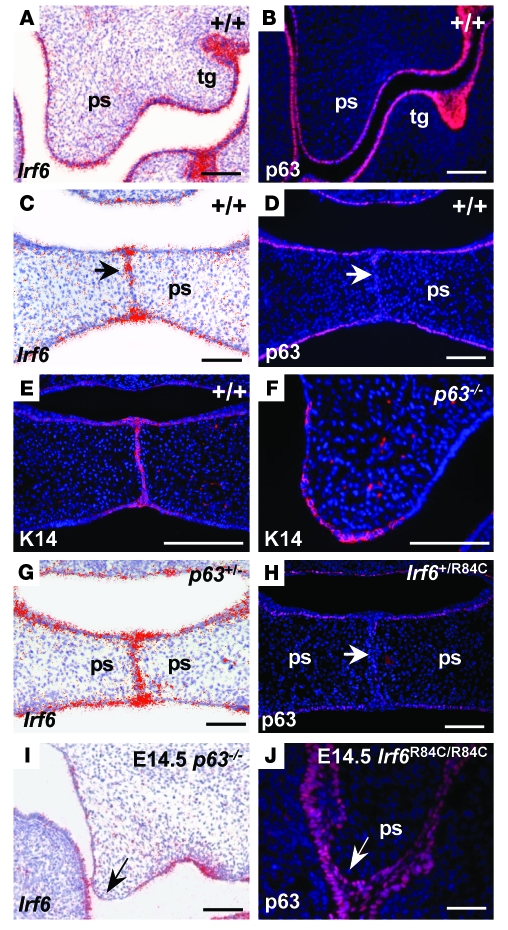
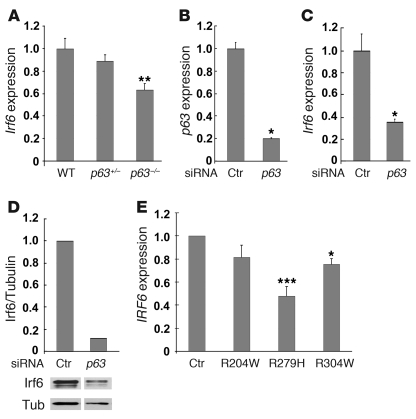
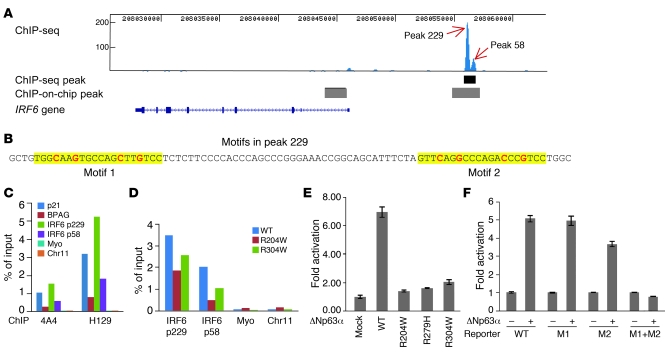
Cleft palate is a common congenital disorder that affects up to 1 in 2,500 live human births and results in considerable morbidity to affected individuals and their families. The etiology of cleft palate is complex, with both genetic and environmental factors implicated. Mutations in the transcription factor-encoding genes p63 and interferon regulatory factor 6 (IRF6) have individually been identified as causes of cleft palate; however, a relationship between the key transcription factors p63 and IRF6 has not been determined. Here, we used both mouse models and human primary keratinocytes from patients with cleft palate to demonstrate that IRF6 and p63 interact epistatically during development of the secondary palate. Mice simultaneously carrying a heterozygous deletion of p63 and the Irf6 knockin mutation R84C, which causes cleft palate in humans, displayed ectodermal abnormalities that led to cleft palate. Furthermore, we showed that p63 transactivated IRF6 by binding to an upstream enhancer element; genetic variation within this enhancer element is associated with increased susceptibility to cleft lip. Our findings therefore identify p63 as a key regulatory molecule during palate development and provide a mechanism for the cooperative role of p63 and IRF6 in orofacial development in mice and humans.


Figures

Figure 1
Figure 1. Phenotype analysis of wild-type and p63+/–Irf6+/R84C mice.
(AH) Scanning electron microscope (AD) and histological (EH) analyses of E13.5 and E14.5 wild-type and p63+/–Irf6+/R84C mice. At E13.5, palatal development initiated normally (A, B, E, and F). At E14.5, the palatal shelves of wild-type mice adhered and commenced fusion (C and G); in contrast, the secondary palate of p63+/–Irf6+/R84C embryos remained cleft (D and H). (I and J) Low-magnification views at E18.5 indicate that whereas the palatal shelves of wild-type mice fused, those of p63+/–Irf6+/R84C mice pulled apart, leaving a large oronasal cavity. (K and L) Higher-magnification views of the boxed regions in I and J, respectively, indicate that the palatal epithelia of p63+/–Irf6+/R84C embryos exhibited signs of differentiation with distinct nasal and oral characteristics. ps, palatal shelf; t, tongue; ns, nasal septum; n, nasal epithelium; o, oral epithelium. Scale bars: 500 μm (AD); 200 μm (EH); 400 μm (I and J); 50 μm (K and L).
Figure 2
Figure 2. Cleft palate observed in p63+/–Irf6+/R84C mice.
(A and B) TEM analysis of the MEE at E14.5 revealed highly disordered basal and periderm cells in p63+/–Irf6+/R84C mice compared with their wild-type littermates. (CJ) Deconvolution analysis of the palatal shelves. (C and D) At E13.5, K17 appeared filamentous and incorrectly localized in the MEE (D, arrows). (E and F) At E14.5, whereas K17 expression was confined to the periderm of wild-type mice, K17 was expressed throughout the MEE in p63+/–Irf6+/R84C embryos. (GJ) K14 and K17 dual staining. (G and I) In wild-type mice, K14-positive basal cells were covered by K17/K14-positive periderm cells. (H and J) In p63+/–Irf6+/R84C embryos, the entire MEE stained positively for both K14 and K17. (KM) At E15.5, whereas the MEE of wild-type mice degenerated, K17-positive cells persisted over the MEE of p63+/–Irf6+/R84C embryos. (M) Higher-magnification view of the boxed region in L. (NQ) In vitro culture indicated that after 72 hours of forced contact, the palatal shelves of p63+/–Irf6+/R84C mice fused. K14 expression in both wild-type and p63+/–Irf6+/R84C palates was evident in remnants of the nasal and oral epithelia only (P and Q, asterisks). bm, basement membrane; p, periderm cell; b, basal cell; ne, nasal epithelium. Scale bars: 5 μm (A and B); 10 μm (CF, I, J, and M); 50 μm (G and H); 100 μm (K, L, and NQ).
Figure 3
Figure 3. Irf6 and p63 expression during palatal development.
(A and B) At E13.5, Irf6 and p63 were expressed in similar domains in the epithelia of the oral cavity and in the tooth germs (tg) of wild-type mice. (C and D) At E14.5, Irf6 transcripts were strongly expressed in the midline seam and epithelial triangles (C, arrow); in contrast, p63 protein levels were downregulated in the MEE (D, arrow). (E and F) Immunofluorescence assays using K14 indicated that the palatal shelves of p63–/– mice, which exhibited a thin and fragile epithelium, were competent to express this protein. (G and H) Analysis of p63 and Irf6 in Irf6+/R84C and p63+/– embryos, respectively. Expression was unchanged in the heterozygous animals. (I) In E14.5 p63–/– palatal shelves, Irf6 transcripts were downregulated in the MEE (arrow). (J) p63 expression was maintained throughout the MEE of E14.5 Irf6R84C/R84C palatal shelves (arrow). Scale bars: 100 μm.
Figure 4
Figure 4. Irf6 in p63-deficient cells.
(A) qPCR analysis of palatal shelves dissected from E13.5 wild-type, p63+/–, and p63–/– embryos indicated that Irf6 transcripts were reduced to approximately 90% and 63%, respectively, of normal levels. **P = 0.01 versus p63+/– and wild-type (Mann-Whitney U test). (B) siRNA knockdown of p63 in mouse primary keratinocytes reduced p63 levels 5-fold. *P = 0.05 versus control scrambled siRNA (Mann-Whitney U test). (C) Irf6 transcript levels after p63 siRNA knockdown were reduced more than 60%. *P = 0.05 versus control scrambled siRNA (Mann-Whitney U test). (D) Western analysis reveals reduced Irf6 protein levels in mouse primary keratinocytes after p63 siRNA knockdown. Quantitation, shown above the Western blot, shows Irf6 levels relative to tubulin. Samples were run on the same gel but were noncontiguous (white line). (E) qPCR analysis of IRF6 in human primary keratinocytes derived from normal control individuals and patients with EEC syndrome (R204W, R279H, and R304W) showed reduced IRF6 levels when the DNA-binding function of p63 was impaired. *P = 0.05, ***P = 0.001 versus control (Kruskal-Wallis 1-way ANOVA followed by post-hoc Dunn’s test). Data represent mean ± SEM.
Figure 5
Figure 5. A p63 binding site upstream of IRF6 functions as an enhancer element.
(A) ChIP-seq analysis of p63 binding in human primary keratinocytes. The p63 binding site obtained from ChIP-seq is shown as a black bar below the double peak (peak 229 and peak 58), and p63 binding sites reported previously by ChIP-on-chip (19) are shown as gray bars. (B) The 2 p63 binding motifs identified within peak 229 are highlighted in yellow, with the most conserved cytosine and guanine bases shown in red. (C) ChIP-qPCR analysis of p63 binding using p63 antibodies 4A4 and H129. Specific binding of p63 to the positive controls p21 and BPAG as well as to peak 229 (p229) and peak 58 (p58) regions, but not to negative controls myoglobin exon 2 (myo) and a no-gene region (chr11), was observed. (D) ChIP-qPCR analysis of R204W and R304W cell lines indicated reduced p63 binding. (E) Transient transfection assays showed that wild-type p63 strongly activated transcription through peak 229. In contrast, activation by the p63 mutants R204W, R279H, and R304W was greatly reduced, with the highest level (approximately 2-fold) in R304W. (F) Site-directed mutagenesis of the conserved cytosine and guanine bases showed that both motifs in peak 229 were responsive to p63 and that mutation abolished transactivation. WT, reporter of wild-type peak 229; M1, mutation of motif 1; M2, mutation of motif 2; M1+M2, mutation of both motifs.

Comment in

References

    1. Vanderas AP. Incidence of cleft lip, cleft palate, and cleft lip and palate among races: a review. Cleft Palate J. 1987;24(3):216–225. - PubMed
    1. Murray JC, et al. Clinical and epidemiologic studies of cleft lip and palate in the Philippines. Cleft Palate Craniofac J. 1997;34(1):7–10. doi: 10.1597/1545-1569(1997)034<0007:CAESOC>2.3.CO;2. - DOI - PubMed
    1. Murray JC. Gene/environment causes of cleft lip and/or palate. Clin Genet. 2002;61(4):248–256. doi: 10.1034/j.1399-0004.2002.610402.x. - DOI - PubMed
    1. Mossey PA, Little J, Munger RG, Dixon MJ, Shaw WC. Cleft lip and palate. Lancet. 2009;374(9703):1773–1785. - PubMed
    1. Jones MC. Etiology of facial clefts: prospective evaluation of 428 patients. Cleft Palate J. 1988;25(1):16–20. - PubMed

Publication types