. 2010 Sep;30(9):1661-70.
doi: 10.1038/jcbfm.2010.56. Epub 2010 Apr 28.

Artificial neural network prediction of ischemic tissue fate in acute stroke imaging

Affiliations

Artificial neural network prediction of ischemic tissue fate in acute stroke imaging

Shiliang Huang et al. J Cereb Blood Flow Metab. 2010 Sep.

Abstract

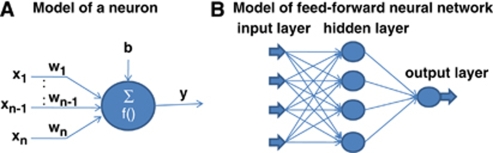
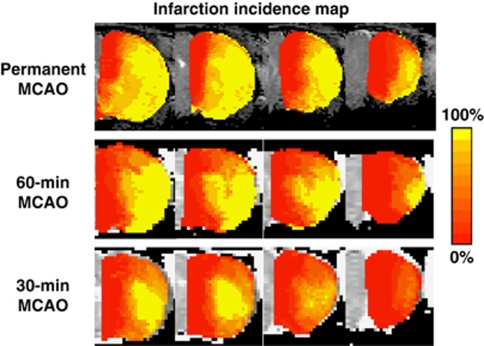
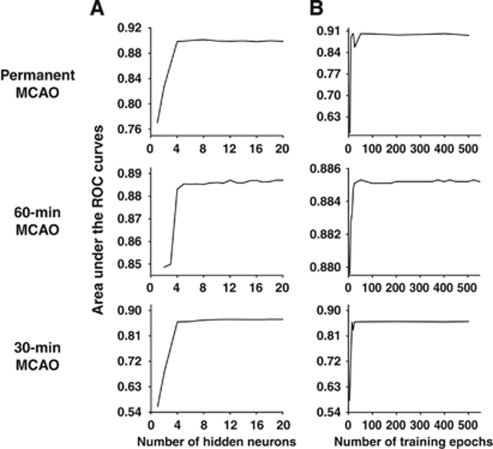
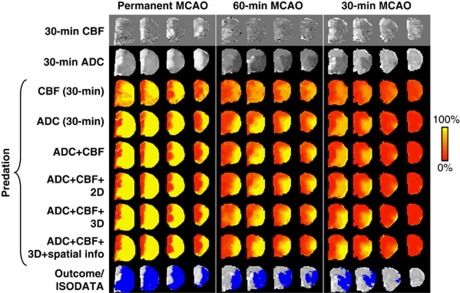
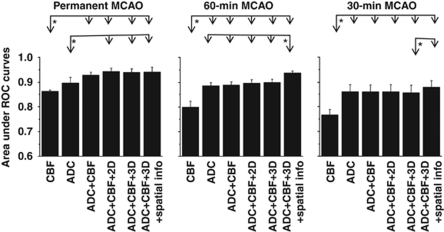
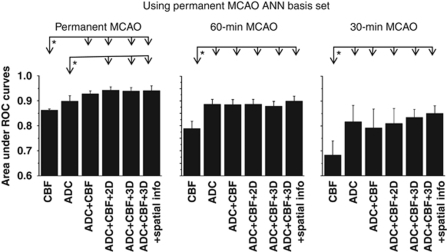
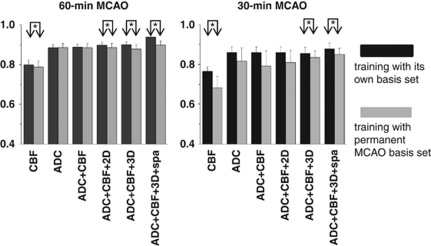
Multimodal magnetic resonance imaging of acute stroke provides predictive value that can be used to guide stroke therapy. A flexible artificial neural network (ANN) algorithm was developed and applied to predict ischemic tissue fate on three stroke groups: 30-, 60-minute, and permanent middle cerebral artery occlusion in rats. Cerebral blood flow (CBF), apparent diffusion coefficient (ADC), and spin-spin relaxation time constant (T2) were acquired during the acute phase up to 3 hours and again at 24 hours followed by histology. Infarct was predicted on a pixel-by-pixel basis using only acute (30-minute) stroke data. In addition, neighboring pixel information and infarction incidence were also incorporated into the ANN model to improve prediction accuracy. Receiver-operating characteristic analysis was used to quantify prediction accuracy. The major findings were the following: (1) CBF alone poorly predicted the final infarct across three experimental groups; (2) ADC alone adequately predicted the infarct; (3) CBF+ADC improved the prediction accuracy; (4) inclusion of neighboring pixel information and infarction incidence further improved the prediction accuracy; and (5) prediction was more accurate for permanent occlusion, followed by 60- and 30-minute occlusion. The ANN predictive model could thus provide a flexible and objective framework for clinicians to evaluate stroke treatment options on an individual patient basis.


Figures

Figure 1
Figure 1
(A) A model of an artificial neuron and (B) a model of the feed-forward artificial neural network.
Figure 2
Figure 2
Spatial infarction incidence maps for the permanent, 60-, and 30-minute middle cerebral artery occlusion (MCAO) groups. The color bar denotes the infarction incidence from 0% to 100%. The color reproduction of this figure is available on the html full text version of the manuscript.
Figure 3
Figure 3
Optimization of (A) the number of hidden neurons and (B) the number of training epochs for apparent diffusion coefficient (ADC) data obtained from the permanent middle cerebral artery occlusion (MCAO), 60-minute MCAO, and 30-minute MCAO groups.
Figure 4
Figure 4
Predicted infarct maps for the permanent, and 60-, and 30-minute middle cerebral artery occlusion (MCAO) groups using their own artificial neural network (ANN) training basis sets. Multislice images are posterior to the anterior slices from left to right. Predictions were made with cerebral blood flow (CBF) alone, apparent diffusion coefficient (ADC) alone, ADC+CBF, ADC+CBF+2D adjacent pixels, ADC+CBF+3D adjacent pixels, and ADC+CBF+3D adjacent pixels+spatial information. For references, ADC, CBF maps, and iterative self-organizing data analysis algorithm (ISODATA) analysis of end-point lesion volume based on ADC and T2 are also shown. Color bar denotes the probability of infarct from 0% to 100%. The color reproduction of this figure is available on the html full text version of the manuscript.
Figure 5
Figure 5
The areas under receiver-operating characteristic (ROC) curves for the three different occlusion durations: permanent, 30- and 60-minute middle cerebral artery occlusion (MCAO). Predictions for each MCAO group training with its own basis set. Two-way analysis of variance (ANOVA) with multiple comparisons applying Tukey–Kramer's correction; *P<0.05.
Figure 6
Figure 6
The areas under receiver-operating characteristic (ROC) curves for the three different occlusion durations: permanent, 30- and 60-minute middle cerebral artery occlusion (MCAO). Predictions for all MCAO groups training with the permanent MCAO basis set. The panel for the permanent MCAO group is identical to that shown in Figure 5.
Figure 7
Figure 7
Statistical comparison between prediction made with training with its own basis set and that made with the permanent middle cerebral artery occlusion (MCAO) basis set. This figure is a re-plot of Figures 5 and 6 to allow side-by-side comparison. *P<0.05 (paired t-test).

References

    1. An H, Lin W. Quantitative measurements of cerebral blood oxygen saturation using magnetic resonance imaging. J Cereb Blood Flow Metab. 2000;20:1225–1236. - PMC - PubMed
    1. Arenillas JF, Rovira A, Molina CA, Grive E, Montaner J, Alvarez-Sabin J. Prediction of early neurological deterioration using diffusion- and perfusion-weighted imaging in hyperacute middle cerebral artery ischemic stroke. Stroke. 2002;33:2197–2203. - PubMed
    1. Astrup J, Sorensen PM, Sorensen HR. Oxygen and glucose consumption related to Na+/K+ transport in canine brain. Stroke. 1981a;12:726–730. - PubMed
    1. Astrup J, Symon L, Siesjo BK. Thresholds in cerebral ischemia: the ischemic penumbra. Stroke. 1981b;12:723–725. - PubMed
    1. Ball GH, Hall DJ.1965ISODATA: a novel method of data analysis and pattern classificationVol. 4.Menlo Park, CA: Stanford Research Institute; 1–60

Publication types