. 2009;12(Pt 1):297-304.
doi: 10.1007/978-3-642-04268-3_37.

Spatiotemporal atlas estimation for developmental delay detection in longitudinal datasets

Affiliations

Spatiotemporal atlas estimation for developmental delay detection in longitudinal datasets

Stanley Durrleman et al. Med Image Comput Comput Assist Interv. 2009.

Abstract

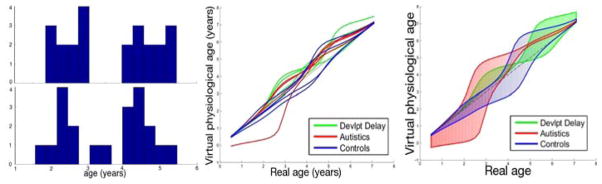
We propose a new methodology to analyze the anatomical variability of a set of longitudinal data (population scanned at several ages). This method accounts not only for the usual 3D anatomical variability (geometry of structures), but also for possible changes in the dynamics of evolution of the structures. It does not require that subjects are scanned the same number of times or at the same ages. First a regression model infers a continuous evolution of shapes from a set of observations of the same subject. Second, spatiotemporal registrations deform jointly (1) the geometry of the evolving structure via 3D deformations and (2) the dynamics of evolution via time change functions. Third, we infer from a population a prototype scenario of evolution and its 4D variability. Our method is used to analyze the morphological evolution of 2D profiles of hominids skulls and to analyze brain growth from amygdala of autistics, developmental delay and control children.


Figures

Fig. 1
Fig. 1
Skull profile of five hominids (in red). The regression model estimates a continuous evolution (in blue) of the Australopithecus, which closely matches the data.
Fig. 2
Fig. 2
Registration of the evolution {Homo habilis-erectus-neandertalensis} (in red) to the evolution {Homo erectus-sapiens sapiens} (in green), shifted to start at the same time. Top row: Regression of the source data (red) gives the continuous evolution in blue. Middle row: The geometrical part φ is applied to each blue frame. This shows morphological changes: the skull is larger, rounder and the jaw less prominent. Bottom row: The time change function ψ is applied to the evolution of the second row. The blue shapes are moved along the time axis (as shown by dashed black lines), but they are not deformed. Black arrows show that a better alignment is achieved when one accounts both for morphological changes and a change of the evolution speed.
Fig. 3
Fig. 3
A- time change function ψ(t) of the registration in Fig. 2 (in black the reference ψ(t) = t). The slope of the curve measures an acceleration between evolutions, which is compatible with the growth of skull volume in b (source: www.bordalierinstitute.com).
Fig. 4
Fig. 4
Mean Scenario of the right Amygdala (right lateral part). Arrows measures the differences between age t+0.2 and age t in the space of currents as in [16]. From age 2 to 2.8, the evolution is mainly a torque at the posterior part; then the structure becomes thicker, mostly at the superior part between age 2.8 and 4 and at the inferior between age 4 and 6; from age 6 the evolution is a mainly a torque at the anterior part.
Fig. 5
Fig. 5. Temporal deformation of the mean scenario
Left: distribution of original (top) and registered (bottom) ages. Middle: time change functions for the 12 subjects. Right: First mode of variation at ±σ of the time change functions for each class. Autistics and controls show the same evolution pattern, but shifted in time.

References

    1. Qiu A, Younes L, Miller M, Csernansky J. Parallel transport in diffeomorphisms distinguishes the time-dependent pattern of hippocampal surface deformation due to healthy aging and the dementia of the alzheimer’s type. NeuroImage. 2008;40:68–76. - PMC - PubMed
    1. Gorczowski K, Styner M, Jeong JY, Marron JS, Piven J, Hazlett HC, Pizer SM, Gerig G. Statistical shape analysis of multi-object complexes. Transactions on Pattern Analysis and Machine Intelligence. 2009 to appear.
    1. Khan A, Beg M. Representation of time-varying shapes in the large deformation diffeomorphic framework. Proc. of ISBI; 2008; 2008. pp. 1521–1524.
    1. Davis B, Fletcher P, Bullitt E, Joshi S. Population shape regression from random design data. Proc. of ICCV; 2007; 2007. pp. 1–7.
    1. Chandrashekara R, Rao A, Sanchez-Ortiz GI, Mohiaddin RH, Rueckert D. Construction of a statistical model for cardiac motion analysis using nonrigid image registration. In: Taylor CJ, Noble JA, editors. IPMI 2003. LNCS. Vol. 2732. Springer; Heidelberg: 2003. pp. 599–610. - PubMed

Publication types

MeSH terms

LinkOut - more resources