. 2010 Apr 28:8:23.
doi: 10.1186/1477-5956-8-23.

Highlights on the capacities of "Gel-based" proteomics

Affiliations

Highlights on the capacities of "Gel-based" proteomics

François Chevalier. Proteome Sci. .

Abstract

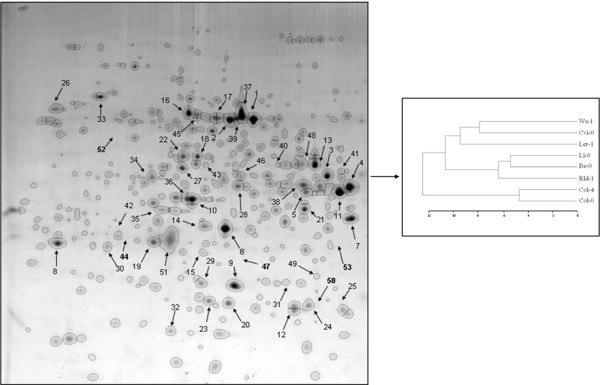
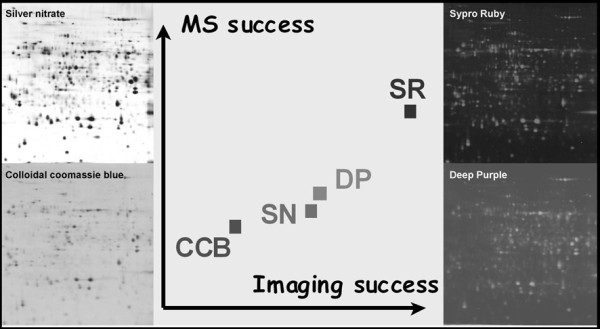
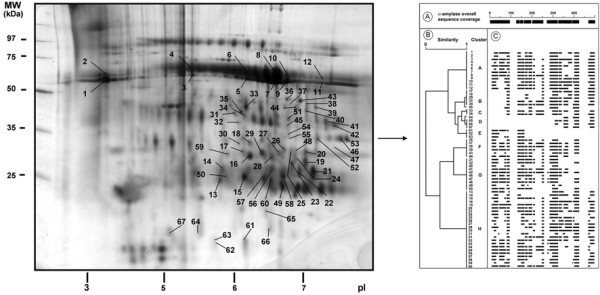
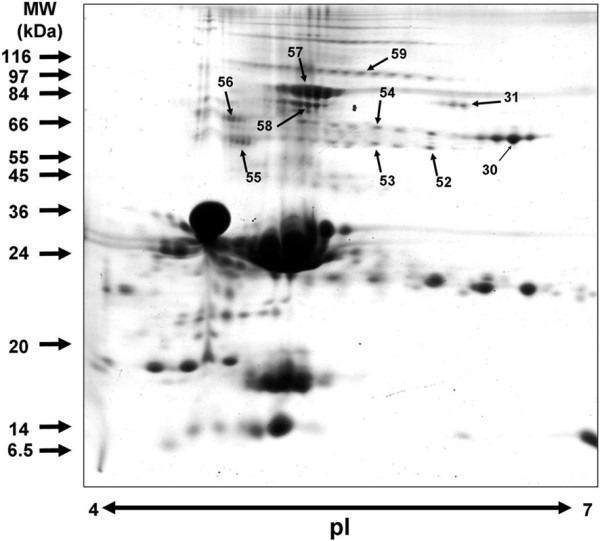
Gel-based proteomic is the most popular and versatile method of global protein separation and quantification. This is a mature approach to screen the protein expression at the large scale, and a cheaper approach as compared with gel-free proteomics. Based on two independent biochemical characteristics of proteins, two-dimensional electrophoresis combines isoelectric focusing, which separates proteins according to their isoelectric point, and SDS-PAGE, which separates them further according to their molecular mass. The next typical steps of the flow of gel-based proteomics are spots visualization and evaluation, expression analysis and finally protein identification by mass spectrometry. For the study of differentially expressed proteins, two-dimensional electrophoresis allows simultaneously to detect, quantify and compare up to thousand protein spots isoforms, including post-translational modifications, in the same gel and in a wide range of biological systems. In this review article, the limits, benefits, and perspectives of gel-based proteomic approaches are discussed using concrete examples.


Figures

Figure 1
Figure 1
Hierarchical clustering of Arabidopsis thaliana ecotypes based on 2DE spot amounts. Soluble proteins from ecotype Col-0 were separated using pH 4-7 IPG in first dimension and 11% SDS-PAGE in second dimension. Proteins spots were visualized by colloidal Coomassie blue staining. The amount of each spot was estimated by its normalized volume as obtained by image analysis [62]. Euclidian distances were then computed for all spots to build the similarity matrix for ecotypes, and clustering was performed using the Ward's method to link the variables.
Figure 2
Figure 2
Impact of staining procedures on mass spectrometry compatibility using visible stains and fluorescent dyes. In these studies, the effects of protein spot properties were integrated to derive prediction of the MS results obtainable with the different dyes for all spots in the gels [24,49]. 100 μg of total protein extracts from Arabidopsis thaliana were focused on pI 4-7 range and separated on gels covering the 15-150 kDa range. By comparison to sensitivity properties of dyes, these simulations enable a first estimation of the overall proteomic capacity of dyes. They argue for a clear advantage in using fluorescent dyes, particularly SR, which cumulates high sensitivity, acceptable identification success on gels loaded with low protein amount, and constant protein sequence coverage. Abbreviations used: colloidal Coomassie blue (CCB), silver nitrate (SN), Sypro Ruby (SR), Deep Purple (DP).
Figure 3
Figure 3
Characterization of isoforms of alpha-amylase in human saliva. A 2DE map of human salivary proteins was performed [68]. Proteins were resolved using pH 3-10NL IPG and 12% SDS-PAGE, and stained with colloidal Coomassie blue. Alpha-amylase spots subsequently identified by MALDI-TOF MS are indicated by respective spot number (left part). According to the mass features of alpha-amylase (right part) identified spots, (A) coverage of the alpha-amylase sequence by the total population of peptides identified (black boxes) in the different alpha-amylase spots, (B) simultaneous clustering of the 67 alpha-amylase spots according to the MW range measured on gels, the MS identification of peptides in the N-terminal and C-terminal and central regions of the sequence, (C) individual spot coverage of the alpha-amylase sequence by peptides identified (black boxes) by MALDI-TOF MS.
Figure 4
Figure 4
Non-reducing 2DE for the study of disulfide-mediated interactions between proteins in raw milk. 2DE of proteins in raw milk separated under non-reducing conditions using a 7-cm pH 4-7 pI range strip for the first dimension, and a 10 to 18% gradient acrylamide gel for the second dimension. The specific/interesting spots as indicated by arrows were submitted to MALDI-TOF mass to identify proteins involved in polymers [69].

References

    1. O'Farrell PH. High resolution two-dimensional electrophoresis of proteins. Journal of Biological Chemistry. 1975;250:4007–4021. - PMC - PubMed
    1. Wan JH, He FC. Technical development of proteomics. Chinese Science Bulletin. 1999;44:1441–1447. doi: 10.1007/BF03183559. - DOI
    1. Gromov PS, Celis JE. From genomics to proteomics. Molecular Biology. 2000;34:508–520. doi: 10.1007/BF02759560. - DOI - PubMed
    1. Govorun VM, Archakov AI. Proteomic technologies in modern biomedical science. Biochemistry-Moscow. 2002;67:1109–1123. doi: 10.1023/A:1020959106412. - DOI - PubMed
    1. Garfin DE. Two-dimensional gel electrophoresis: an overview. Trac-Trends in Analytical Chemistry. 2003;22:263–272. doi: 10.1016/S0165-9936(03)00506-5. - DOI

LinkOut - more resources