. 2010 Jul 2;285(27):20724-31.
doi: 10.1074/jbc.M109.085506. Epub 2010 Apr 28.

Peroxynitrite toxicity in Escherichia coli K12 elicits expression of oxidative stress responses and protein nitration and nitrosylation

Affiliations

Peroxynitrite toxicity in Escherichia coli K12 elicits expression of oxidative stress responses and protein nitration and nitrosylation

Samantha McLean et al. J Biol Chem. .

Abstract

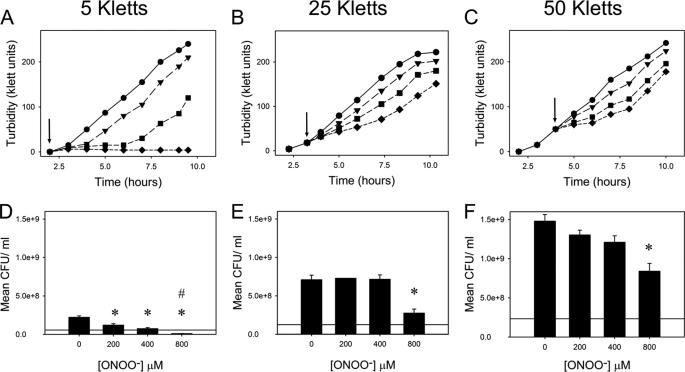
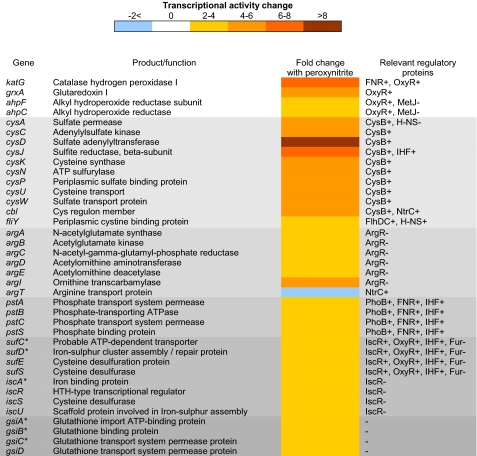
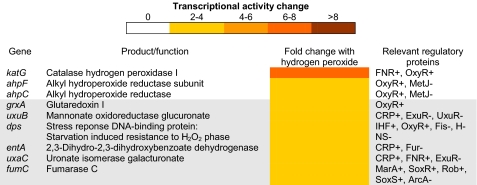
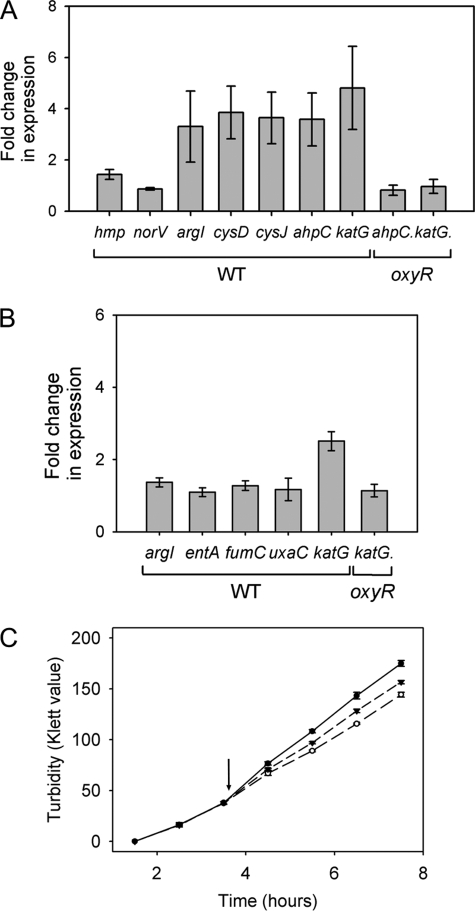
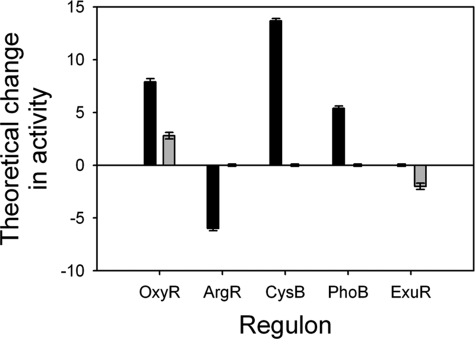
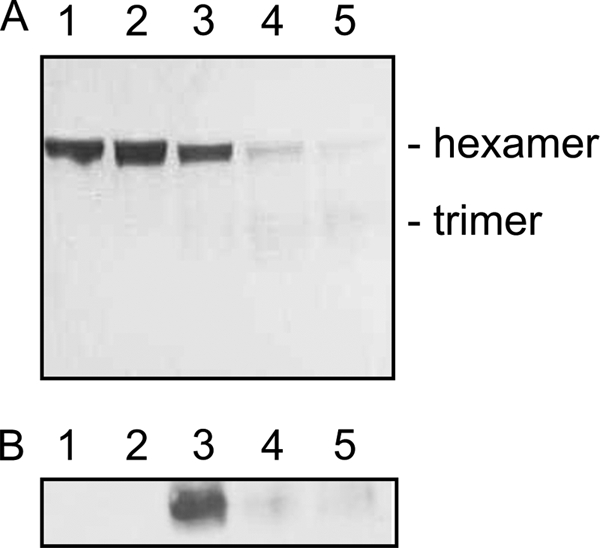
Peroxynitrite is formed in macrophages by the diffusion-limited reaction of superoxide and nitric oxide. This highly reactive species is thought to contribute to bacterial killing by interaction with diverse targets and nitration of protein tyrosines. This work presents for the first time a comprehensive analysis of transcriptional responses to peroxynitrite under tightly controlled chemostat growth conditions. Up-regulation of the cysteine biosynthesis pathway and an increase in S-nitrosothiol levels suggest S-nitrosylation to be a consequence of peroxynitrite exposure. Genes involved in the assembly/repair of iron-sulfur clusters also show enhanced transcription. Unexpectedly, arginine biosynthesis gene transcription levels were also elevated after treatment with peroxynitrite. Analysis of the negative regulator for these genes, ArgR, showed that post-translational nitration of tyrosine residues within this protein is responsible for its degradation in vitro. Further up-regulation was seen in oxidative stress response genes, including katG and ahpCF. However, genes known to be up-regulated by nitric oxide and nitrosating agents (e.g. hmp and norVW) were unaffected. Probabilistic modeling of the transcriptomic data identified five altered transcription factors in response to peroxynitrite exposure, including OxyR and ArgR. Hydrogen peroxide can be present as a contaminant in commercially available peroxynitrite preparations. Transcriptomic analysis of cells treated with hydrogen peroxide alone also revealed up-regulation of oxidative stress response genes but not of many other genes that are up-regulated by peroxynitrite. Thus, the cellular responses to peroxynitrite and hydrogen peroxide are distinct.


Figures

FIGURE 1.
FIGURE 1.
Cell density dependence on growth and viability of E. coli in response to peroxynitrite stress. Cells were stressed with 0 (●), 200 (▼), 400 (■), or 800 μm (♦) peroxynitrite at 5 (A), 25 (B) and 50 (C), Klett units (indicated by arrows). Data are representative of three biological replicates. Viability counts were determined for cells stressed with 0, 200, 400 or 800 μm peroxynitrite at 5 (D), 25 (E), and 50 (F) Klett units after incubation for 1 h. * and # denote a statistically significant reduction in viable cell counts relative to unstressed cells after 1 h and to cell numbers at the time of stress (horizontal line), respectively. CFU, colony-forming units.
FIGURE 2.
FIGURE 2.
Microarray analysis of the differential expression of genes involved in the response to peroxynitrite exposure. The mean fold change in individual gene expression after exposure to 300 μm peroxynitrite compared with unstressed controls grown aerobically is indicated by the color scale bar. Unless otherwise stated, p values were <0.05; * indicates a p value of between 0.05 and 0.1.
FIGURE 3.
FIGURE 3.
Microarray analysis of the differential expression of genes involved in the response to hydrogen peroxide treatment. The mean fold change in individual gene expression after exposure to 300 μm hydrogen peroxide compared with unstressed controls grown aerobically is indicated by the color scale bar. p values were <0.05.
FIGURE 4.
FIGURE 4.
RT-PCR was used to monitor the expression of genes involved in the response to MnO2-treated peroxynitrite (A) or hydrogen peroxide (B). Cells grown in batch culture were exposed to 300 μm peroxynitrite pretreated with MnO2 or 300 μm hydrogen peroxide, respectively, for 5 min before aliquots of culture were removed to RNAprotect and processed for RT-PCR analysis. The mean fold change in individual gene expression compared with unstressed cells was calculated (n = 3 ± S.E.). C, growth of the oxyR mutant was monitored in the presence and absence (●) of 300 μm peroxynitrite (▼) or hydrogen peroxide (○). Where appropriate, cells were stressed at 50 Klett units (indicated by arrow). Values are mean ± S.E. of three biological repeats.
FIGURE 5.
FIGURE 5.
Probabilistic modeling of transcriptomic data for the effects of peroxynitrite and hydrogen peroxide treatment. Predicted activities (which may be positive or negative) in response to treatment with 300 μm peroxynitrite (black) or hydrogen peroxide (gray) are shown for the transcription factors OxyR, ArgR, CysB, PhoB, and ExuR.
FIGURE 6.
FIGURE 6.
Peroxynitrite causes the nitration and degradation of ArgR in vitro. A, degradation of 60 μm ArgR in the presence of peroxynitrite. Coomassie-stained SDS-polyacrylamide gel of ArgR incubated for 5 min with peroxynitrite in the following molar ratios: lane 1, 1:0; lane 2, 1:1; lane 3, 1:10; lane 4, 1:50, and lane 5, 1:100. B, 20 μm ArgR was incubated with peroxynitrite at a molar ratio of 1:50 for varying lengths of time, followed by SDS-PAGE and Western blot analysis against 3-nitrotyrosine antibodies. Lane 1, peroxynitrite; lane 2, ArgR; lanes 3–5, ArgR incubated with peroxynitrite for 5, 30, and 60 min, respectively.

References

    1. Beckman J. S., Beckman T. W., Chen J., Marshall P. A., Freeman B. A. (1990) Proc. Natl. Acad. Sci. U.S.A. 87, 1620–1624 - PMC - PubMed
    1. Bryk R., Griffin P., Nathan C. (2000) Nature 407, 211–215 - PubMed
    1. Master S. S., Springer B., Sander P., Boettger E. C., Deretic V., Timmins G. S. (2002) Microbiology 148, 3139–3144 - PubMed
    1. Pfeiffer S., Gorren A. C., Schmidt K., Werner E. R., Hansert B., Bohle D. S., Mayer B. (1997) J. Biol. Chem. 272, 3465–3470 - PubMed
    1. Ischiropoulos H. (2009) Arch. Biochem. Biophys. 484, 117–121 - PubMed

Publication types

MeSH terms