

Rural-urban gradient in seasonal forcing of measles transmission in Niger
- PMID: 20427338
- PMCID: PMC2981991
- DOI: 10.1098/rspb.2010.0536
Rural-urban gradient in seasonal forcing of measles transmission in Niger
Abstract
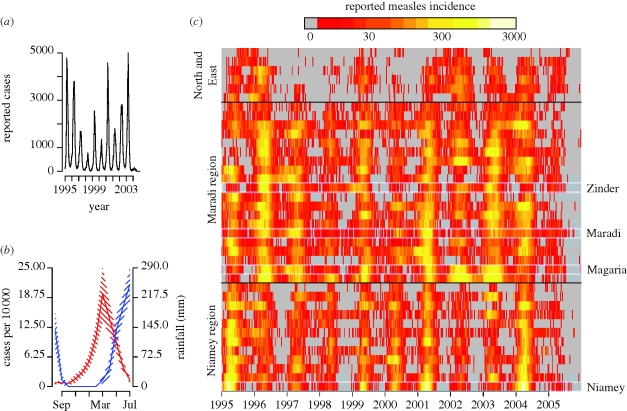
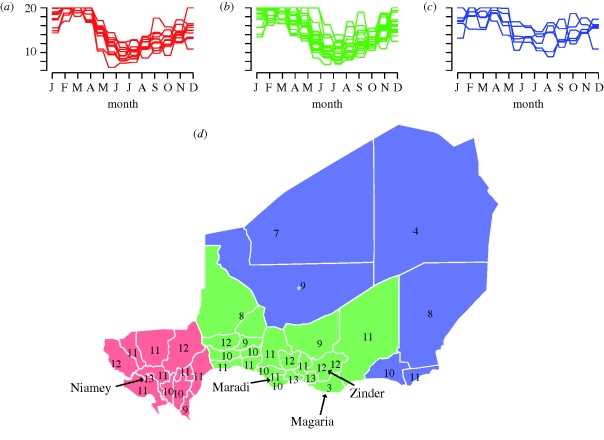
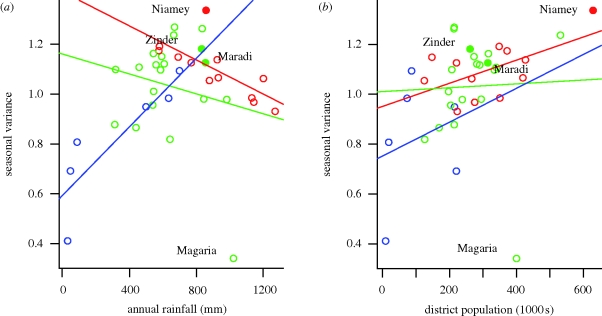
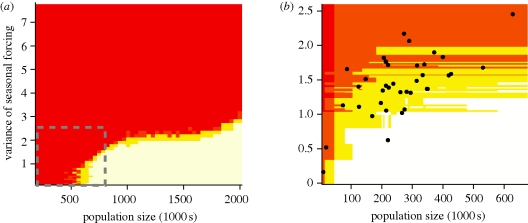
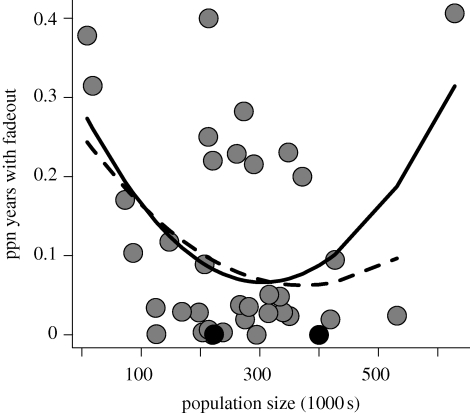
Seasonally driven cycles of incidence have been consistently observed for a range of directly transmitted pathogens. Though frequently observed, the mechanism of seasonality for directly transmitted human pathogens is rarely well understood. Despite significant annual variation in magnitude, measles outbreaks in Niger consistently begin in the dry season and decline at the onset of the seasonal rains. We estimate the seasonal fluctuation in measles transmission rates for the 38 districts and urban centres of Niger, from 11 years of weekly incidence reports. We show that transmission rates are consistently in anti-phase to the rainfall patterns across the country. The strength of the seasonal forcing of transmission is not correlated with the latitudinal rainfall gradient, as would be expected if transmission rates were determined purely by environmental conditions. Rather, seasonal forcing is correlated with the population size, with larger seasonal fluctuation in more populous, urban areas. This pattern is consistent with seasonal variation in human density and contact rates due to agricultural cycles. The stronger seasonality in large cities drives deep inter-epidemic troughs and results in frequent local extinction of measles, which contrasts starkly to the conventional observation that large cities, by virtue of their size, act as reservoirs of measles.
Figures
References
-
- Altizer S., Dobson A., Hosseini P., Hudson P., Pascual M., Rohani P.2006Seasonality and the dynamics of infectious diseases. Ecol. Lett. 9, 467–484 (doi:10.1111/j.1461-0248.2005.00879.x) - DOI - PubMed
-
- Aron J. L., Schwartz I. B.1984Seasonality and period-doubling bifurctions in an epidemic model. J. Theor. Biol. 110, 665–679 (doi:10.1016/S0022-5193(84)80150-2) - DOI - PubMed
-
- Bartlett M. S.1957Measles periodicity and community size. J. R. Statist. Soc. Ser. 120, 48–70 (doi:10.2307/2342553) - DOI
-
- Bauch C. T., Earn D. J. D.2003Transients and attractors in epidemics. Proc. R. Soc. Lond. B 270, 1573–1578 (doi:10.1098/rspb.2003.2410) - DOI - PMC - PubMed
-
- Bharti N., Djibo A., Ferrari M. F., Grais R. F., Tatem A. J., McCabe C. A., Bjornstad N., Grenfell B. T.In press Measles hotspots and epidemiological connectivity. Epidemiol. Infect. (doi:10.1017/S0950268809991385) - DOI - PMC - PubMed
Publication types
MeSH terms
Grants and funding
LinkOut - more resources
Full Text Sources
Medical
