. 2010 May;59(5):655-65.
doi: 10.1136/gut.2009.204354.

Signals from dying hepatocytes trigger growth of liver progenitors

Affiliations

Signals from dying hepatocytes trigger growth of liver progenitors

Youngmi Jung et al. Gut. 2010 May.

Abstract

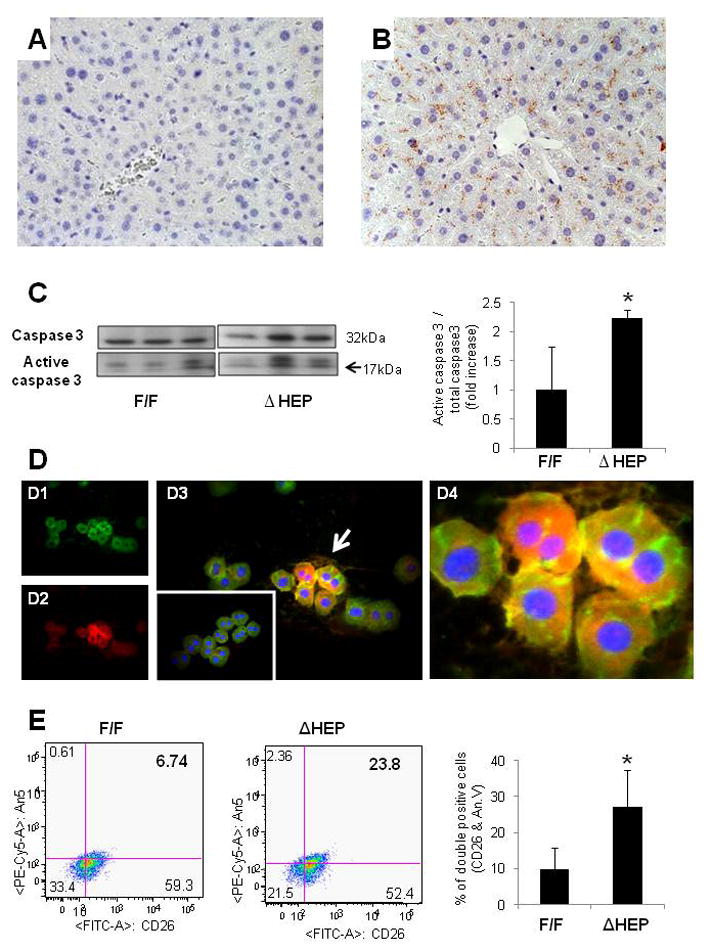
Objective: The death rate of mature hepatocytes is chronically increased in various liver diseases, triggering responses that prevent liver atrophy, but often cause fibrosis. Mice with targeted disruption of inhibitor kappa B kinase (Ikk) in hepatocytes (HEP mice) provide a model to investigate this process because inhibiting Ikk-nuclear factor-kappaB (NF-kappaB) signalling in hepatocytes increases their apoptosis.

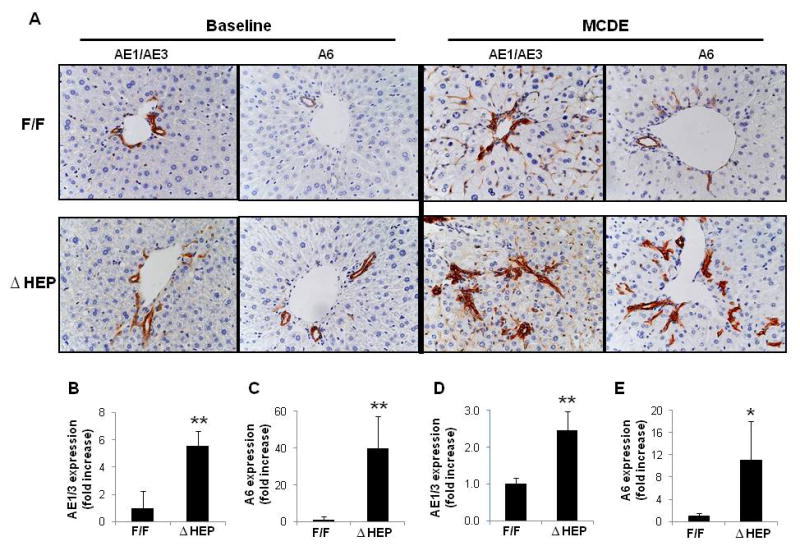
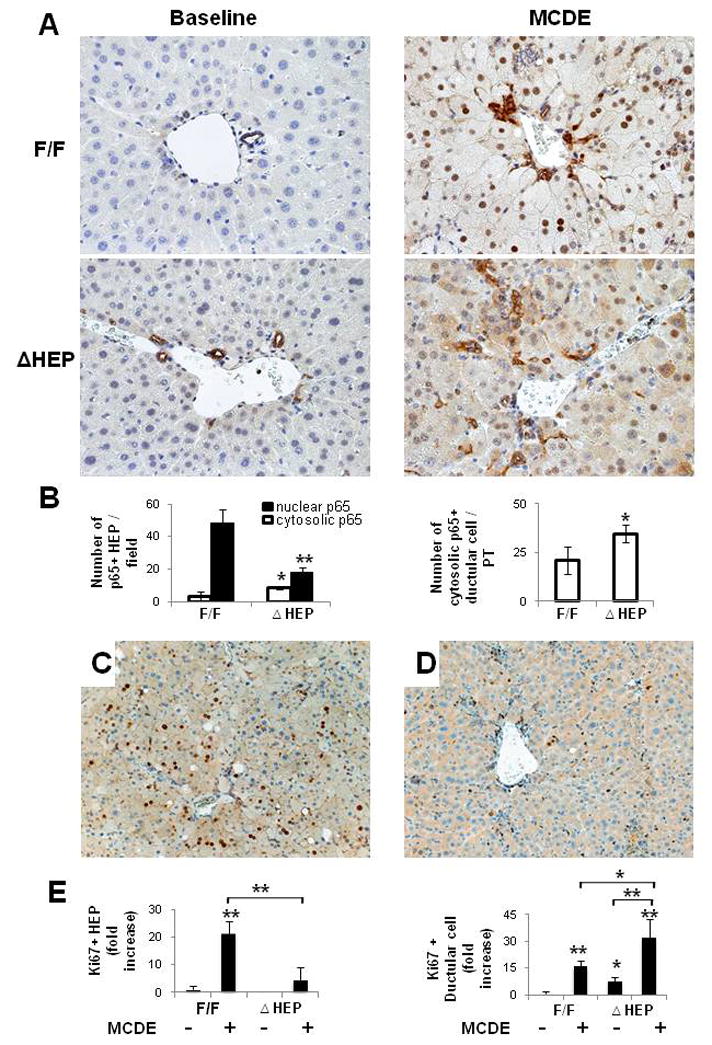
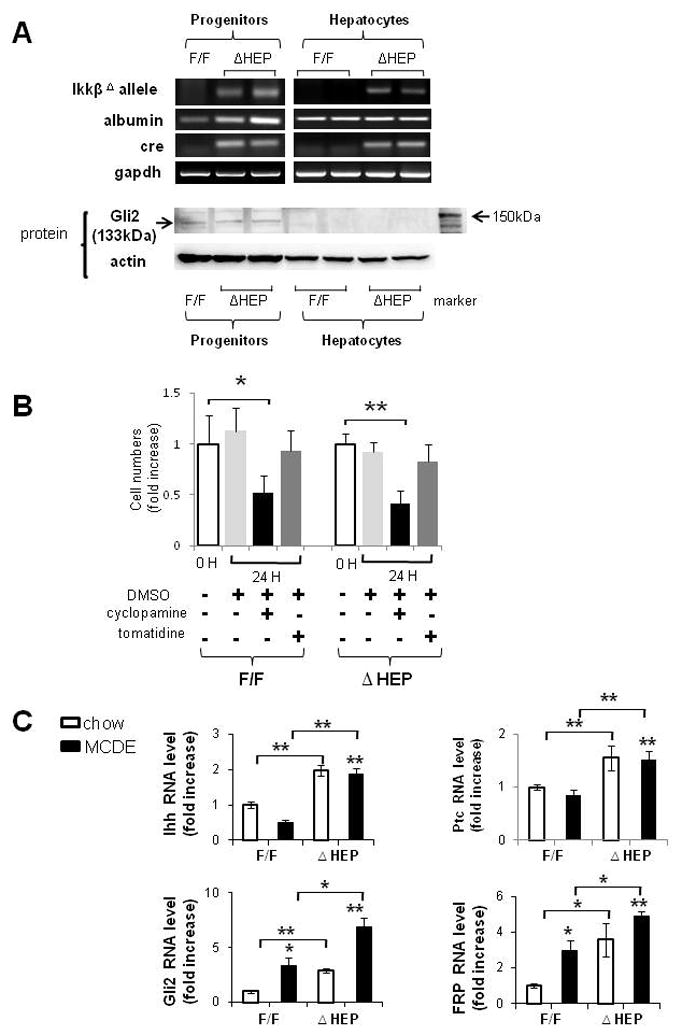
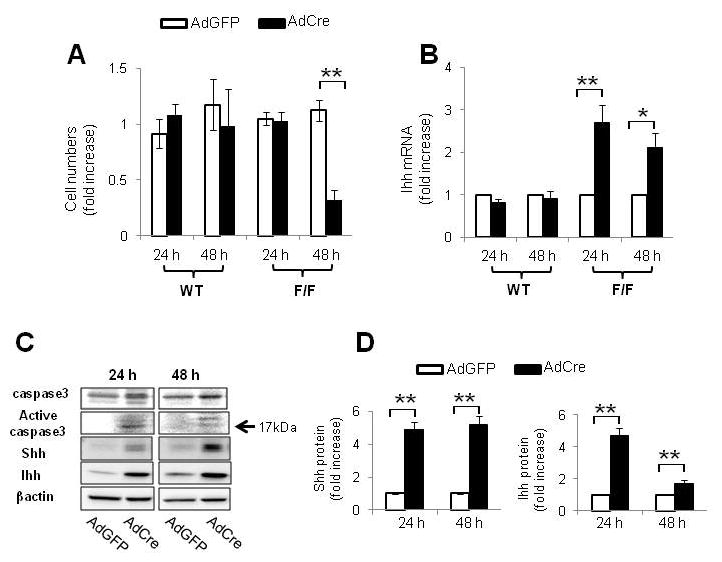
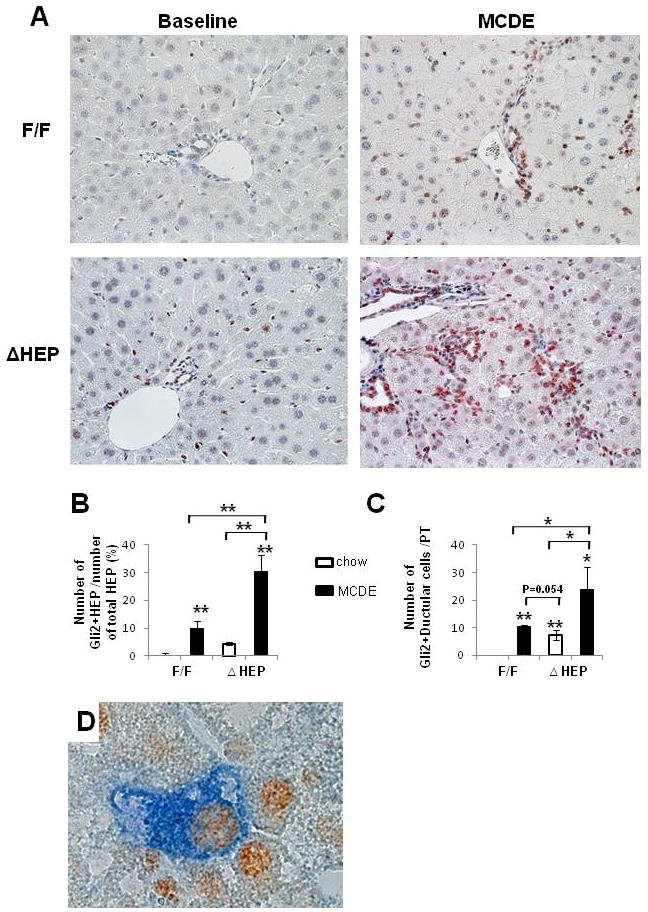
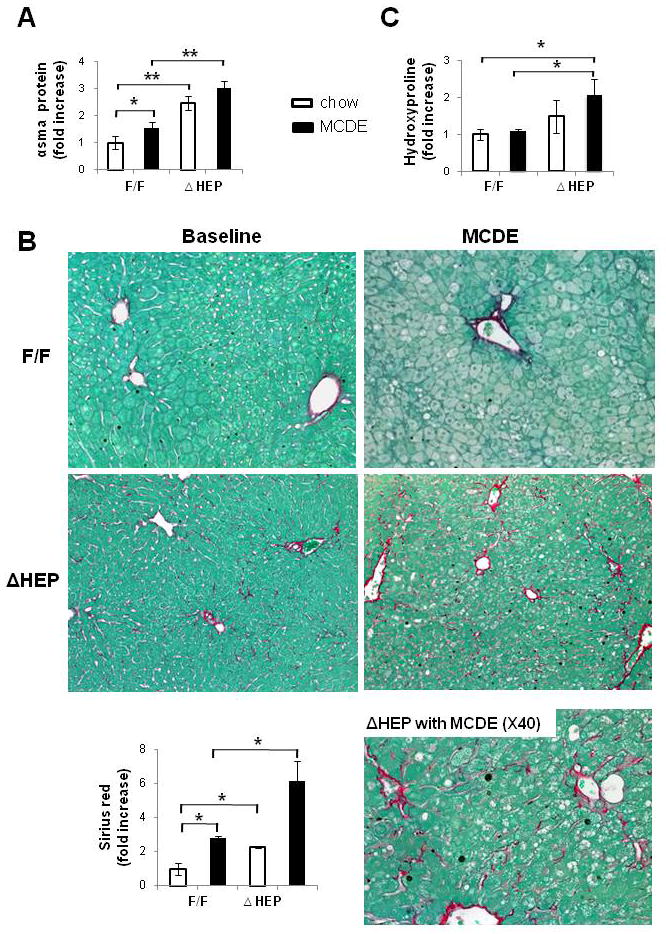
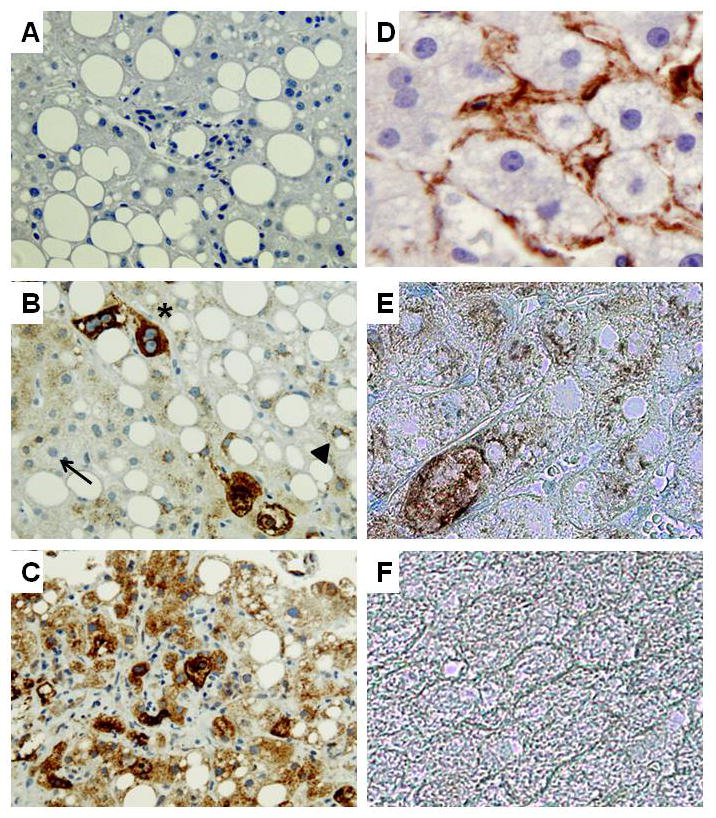
Methods: Cell proliferation, apoptosis, progenitors, fibrosis and production of Hedgehog (Hh) ligands (progenitor and myofibroblast growth factors) were compared in HEP and control mice before and after feeding methionine choline-deficient ethionine-supplemented (MCDE) diets. Ikkbeta was deleted from primary hepatocytes to determine the effects on Hh ligand production; Hh signalling was inhibited directly in progenitors to determine the effects on viability. Liver sections from patients were examined to assess relationships between hepatocyte production of Hh ligands, accumulation of myofibroblastic cells and liver fibrosis.

Results: Disrupting the Ikk-NF-kappaB pathway in hepatocytes inhibited their proliferation but induced their production of Hh ligands. The latter provided viability signals for progenitors and myofibroblasts, enhancing accumulation of these cell types and causing fibrogenesis. Findings in the mouse models were recapitulated in diseased human livers.

Conclusion: Dying mature hepatocytes produce Hh ligands which promote the compensatory outgrowth of progenitors and myofibroblasts. These results help to explain why diseases that chronically increase hepatocyte death promote cirrhosis.


Conflict of interest statement

Disclosures

All authors declare that they have no conflict of interests or financial interests

Figures

Figure 1
Figure 1. Increased hepatocyte apoptosis in IkkβΔHep mice
(A–B) Liver sections stained to demonstrate activated caspase 3 from representative IkkβF/F (A), and IkkβΔHep (B) mice (X40). (C) Western blot analysis for caspase 3 in whole liver extracts from IkkβF/F and IkkβΔHep mice (n = 3 mice/group). Densitometric data are displayed as mean ± SD (*P < 0.05 vs IkkβF/F group). (D1–4) Double immunoflorescent staining for albumin (green) and annexin V (red) in representative primary hepatocyte cytospins from IkkβF/F and IkkβΔHep mice: Albumin (green, D1), Annexin V (red, D2) and merged image of Albumin and Annexin V (yellow, D3) in hepatocytes from IkkβΔHep mice. Arrows indicate the albumin and annexin V- double positive (yellow) hepatocytes which are magnified in d4. The inserted image in D3 shows the merged images of representative Albumin/Annexin V-stained hepatocytes from IkkβF/F mice (X40). (E) Representative FACS analysis of primary hepatocytes from IkkbF/F and Ikkβ ΔHep mice. Cells were incubated with antibodies to CD26 and Annexin V. (F) Graphic summary of FACS data (n = 4 mice/group). Results are expressed as mean ± SD (*P < 0.05 vs IkkβF/F group).
Figure 2
Figure 2. Increased hepatic progenitor populations in IkkβΔHep mice before and after hepatic damage
(A) Immunohistochemical staining for progenitor markers, AE1/AE3 and A6 in liver sections from representative IkkβF/F and IkkβΔHep mice before (baseline) and after MCDE diets for 1week (X40). Quantitative AE1/AE3 (B, D) or A6 (C, E) immunohistochemistry data from IkkβF/F and IkkβΔHep mice before (B; AE1/AE3, C: A6) and after injury (D; AE1/AE3, E: A6). AE1/AE3 or A6-positive cells were measured by morphometry in 8 portal triads (PT)/section. Mean ± SD are graphed (*P<0.05, **P<0.005 vs IkkβF/F group).
Figure 3
Figure 3. Reduced nuclear localization of NFκBp65 and decreased hepatoctye Ki67 expression in IkkβΔHep mice after hepatic injury
(A) Immunohistochemical staining for NFκB p65 in liver from representative IkkβF/F and IkkβΔHep mice before (baseline) and after MCDE diets for 1week (X40). (B) Quantitative NFkB p65 immunohistochemistry data from MCDE-fed mice (n = 4 mice/group). The numbers of hepatocytic cells (HEP) or ductular cells with nuclear or cytosolic NFκB p65(+) were counted in 8 portal triads (PT)/section. Results are expressed as numbers of NFκB p65(+) cells per PT and graphed as mean ± SD results (*P<0.05, **P<0.005 vs IkkβF/F MCDE-fed group). (C–D) Immunohistochemical staining with Ki67 (cell proliferation marker) in liver sections from representative IkkβF/F (D) and IkkβΔHep (E) mice after MCDE diet-induced liver injury. (E) Quantitative Ki67 immunohistochemistry data from all mice (n = 4 mice/group). The numbers of Ki67 (+) hepatocytic cells (HEP) and ductular cells were counted in 8 PT/section. Ki67 (+) HEP were quantified by counting total number of Ki 67(+) HEP/field and dividing by the total number of hepatocyes/field. Ki67(+) ductular cells were quantified by dividing the total number of positive cells by the total number of PT. Mean ± SD results are graphed (*P<0.05, **P<0.005 vs IkkβF/F chow-fed control group).
Figure 4
Figure 4. Cell type-specific differences in survival factor signaling in progenitors and mature hepatocytes from IkkβΔHep mice, as well as IkkβΔHep livers
(A) Primary hepatocytes and liver progenitors were harvested from IkkβF/F mice and IkkβΔHep mice (n = 15 mice/group). Due to the relatively low numbers of progenitors in adult livers, progenitor cells were pooled from 2–3 mice/group for RNA and protein extraction. QRT-PCR analysis of RNA expression of the mutant Ikkβ allele, albumin, cre recombinase and gapdh in representative mice. Western blot analysis of Gli2 (133kDa) and β actin expression in the same mice. (B)Primary progenitors from both groups were then cultured with cyclopamine (3μM) or tomatidine (3μM) for 24 h. Control wells were treated with an equal volume of vehicle (DMSO) for the same treatment period. At the end of the treatment period, growth (cell number) was assessed using the CCK-8 assay. Each experiment was replicated three times. Mean ± SD results are graphed (*P<0.05, **P<0.005 vs respective 0 hour control group). (C) QRT-PCR analysis of liver RNA from chow-fed IkkβF/F and IkkβΔHep mice (open bars), and MCDE diet-fed IkkβF/F and IkkβΔHep mice (closed bars) for Indian hedgehog (Ihh), Patched (Ptc), Gli2 and Frizzled related peptide (Frp)1 (n = 4 mice/group/treatment). Mean ± SD results are graphed (*P<0.05, **P<0.005 vs IkkβF/F chow-fed control group).
Figure 5
Figure 5. Deleting Ikkb in hepatocytes promotes production of Hh ligands
(A) Primary hepatocytes were isolated from WT and IkkβF/F mice (n = 5/group) and cultured in the presence of adenoviral vectors carrying green fluorescent protein (AdGFP) or Cre recombinanse (AdCre). Cultures were analyzed at 24 and 48 hours. In each experiment, quintuplicate wells were assayed. Each experiment was replicated three times. (A) Cell numbers were measured by CCK8 assay and (B) Indian hedgehog ligand (Ihh) expression was evaluated by QRT PCR analysis. Mean ± SD results are graphed (*P<0.05, **P<0.005 vs AdGFP-treated cells in Ikkβ F/F group). (C) Representative Western blot analysis of caspase 3, Shh and Ihh ligands in primary hepatocytes isolated from IkkβF/F mice and treated with either AdGFP or AdCre for 24 or 48 h. (D) Cumulative densitometric analysis of Shh and Ihh Western Blots Results are displayed as mean ± SD (**P<0.005 vs AdGFP-treated cells in Ikkβ F/F group ).
Figure 6
Figure 6. Increased accumulation of Hh-responsive cells in Ikk ΔHep mice after liver injury
(A) lmmunohistochemical staining for Gli2 in representative IkkβF/F and IkkβΔHep mice before (baseline) and after MCDE diets for 1week (X40). (B–C) Quantitative Gli2 immunohistochemistry data from all mice (n = 4 mice/group). Gli2 (+) hepatocytic cells (HEP) or ductular cells were counted in 8 (X40 magnification) fields that contained portal triads (PT). (B) Gli2 (+) hepatocytic cells were expressed as % of Gli2 (+) hepatocyte nuclei/total HEP. (C) Gli2 (+) ductular cells were quantified by dividing the total number of positive cells by the total number of PT. Mean ± SD results are graphed (*P<0.05, **P<0.005 vs IkkβF/F chow-fed control group). (D) Double immunohistochemical staining with Gli2 (brown) and Pan CK (blue) in Ikkβ ΔHep after MCDE treatment (original magnification X63).
Figure 7
Figure 7. Enhanced fibrogenesis and liver fibrosis in IkkβΔHep mice
(A)α-smooth muscle actin (α-sma) expression was assessed in whole liver proteins from IkkβF/F and IkkβΔHep mice (n = 3/group/treatment) using Western blot analysis. (B) Sirius red staining in liver sections from representative mice (X20 or X40). Graph demonstrates mean ± SD morphometric data from all mice (n = 4/group/greatment). (C) Hepatic hydroxyproline content in all mice (n = 4 mice/group). All results are displayed as mean ± SD (*P<0.05, **P<0.005 vs IkkβF/F chow-fed control group).
Figure 8
Figure 8. Increased expression of Hh ligand by hepatocytes in NASH patients with fibrosis
Immunohistochemistry was used to assess Shh and αSMA expression in healthy control livers (n = 3) and in livers from patients with NASH with early (F2) fibrosis (n = 6) or advanced (F4) fibrosis (n = 6). Representative photomicrographs are shown. A) Negative control for Shh immunostaining in which the primary anti-Shh antibody was eliminated and section was exposed to secondary antibody only. B) NASH liver with early fibrosis shows hepatocytes that express no Shh (thin arrow), low levels of Shh (arrow head), or higher levels of Shh (*) C) NASH liver with advanced fibrosis shows many hepatocytes that are strongly stained for Shh. D) Single immunostaining for a-SMA (brown) in NASH liver with early fibrosis. E) Double staining for a-SMA (blue) and Shh (brown) in NASH liver with early fibrosis. F) Double staining for a-SMA and Shh in healthy control liver (A–C:X40, D–F: X100).

References

    1. Henderson NC, Forbes SJ. Hepatic fibrogenesis: from within and outwith. Toxicology. 2008;254:130–5. - PubMed
    1. Michalopoulos GK, DeFrances MC. Liver regeneration. Science. 1997;276:60–6. - PubMed
    1. Hacker H, Karin M. Regulation and function of IKK and IKK-related kinases. Sci STKE. 2006:re13. - PubMed
    1. Cosulich SC, James NH, Needham MR, et al. A dominant negative form of IKK2 prevents suppression of apoptosis by the peroxisome proliferator nafenopin. Carcinogenesis. 2000;21:1757–60. - PubMed
    1. Li ZW, Chu W, Hu Y, et al. The IKKbeta subunit of IkappaB kinase (IKK) is essential for nuclear factor kappaB activation and prevention of apoptosis. J Exp Med. 1999;189:1839–45. - PMC - PubMed

Publication types

MeSH terms