. 2010 Jun 15;21(12):1968-81.
doi: 10.1091/mbc.e09-04-0356. Epub 2010 Apr 28.

Spindly/CCDC99 is required for efficient chromosome congression and mitotic checkpoint regulation

Affiliations

Spindly/CCDC99 is required for efficient chromosome congression and mitotic checkpoint regulation

Marin Barisic et al. Mol Biol Cell. .

Abstract

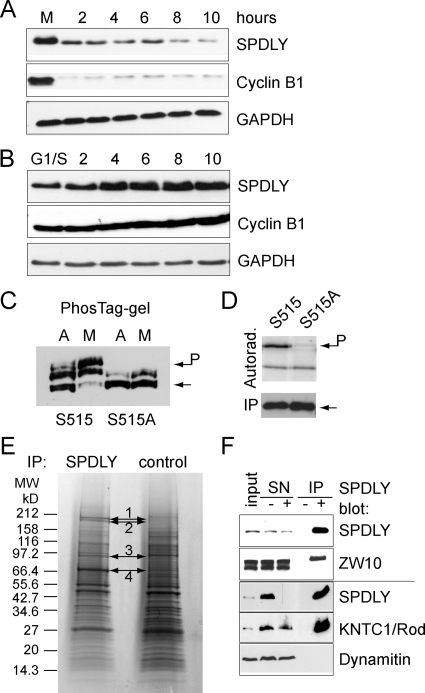
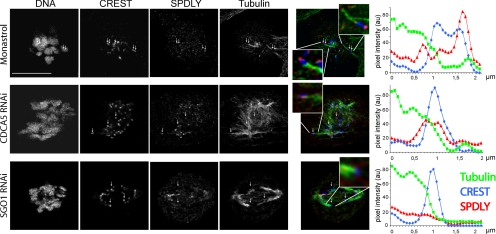
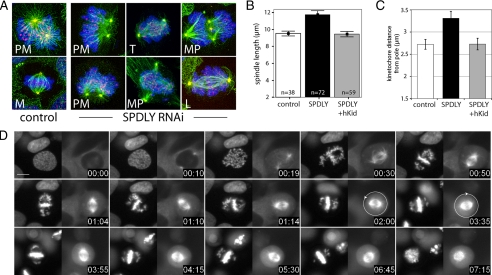
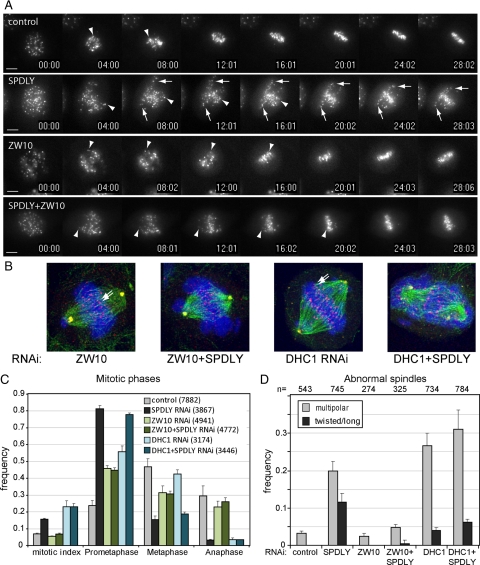
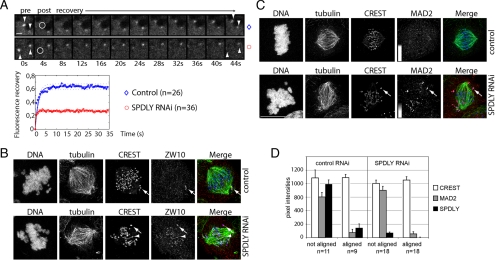
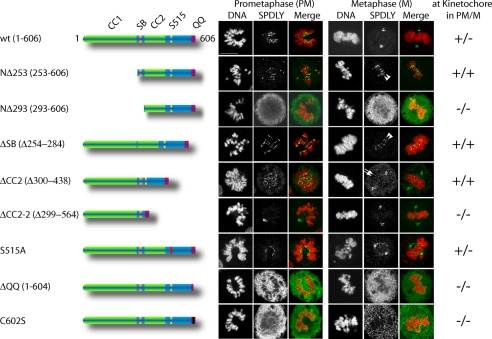
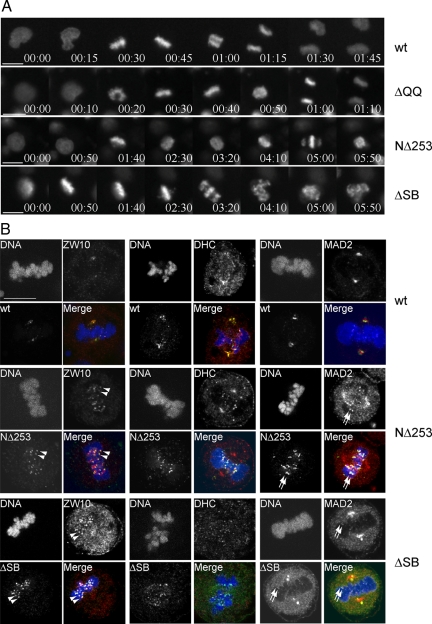
Spindly recruits a fraction of cytoplasmic dynein to kinetochores for poleward movement of chromosomes and control of mitotic checkpoint signaling. Here we show that human Spindly is a cell cycle-regulated mitotic phosphoprotein that interacts with the Rod/ZW10/Zwilch (RZZ) complex. The kinetochore levels of Spindly are regulated by microtubule attachment and biorientation induced tension. Deletion mutants lacking the N-terminal half of the protein (NDelta253), or the conserved Spindly box (DeltaSB), strongly localized to kinetochores and failed to respond to attachment or tension. In addition, these mutants prevented the removal of the RZZ complex and that of MAD2 from bioriented chromosomes and caused cells to arrest at metaphase, showing that RZZ-Spindly has to be removed from kinetochores to terminate mitotic checkpoint signaling. Depletion of Spindly by RNAi, however, caused cells to arrest in prometaphase because of a delay in microtubule attachment. Surprisingly, this defect was alleviated by codepletion of ZW10. Thus, Spindly is not only required for kinetochore localization of dynein but is a functional component of a mechanism that couples dynein-dependent poleward movement of chromosomes to their efficient attachment to microtubules.


Figures

Figure 1.
Figure 1.
Spindly associates with the RZZ complex. (A and B) Spindly is cell cycle regulated. Total cell extracts prepared from nocodazole block/release U2OS (A) and double thymidine block/release HeLa cells (B) at the indicated time points (h) were analyzed by immunoblotting for Spindly, Cyclin B1, and GAPDH. (C) Serine 515 is a major mitotic phosphorylation site. HEK293A cells were transfected with FLAG-tagged versions of wild-type and S515A mutant Spindly and treated with nocodazole for 12 h (mitotic, M) or left untreated (asynchronous, A). FLAG-Spindly immunoprecipitates were separated on 6% PAGE/10 μM PhosTag gels and immunoblotted using an anti FLAG antibody. (D) Immunoprecipitated FLAG-tagged wild-type or S515A Spindly was incubated with recombinant cyclinA/CDK2 and radiolabeled proteins detected by autoradiography. (E) Spindly was immunoprecipitated from 10 mg mitotic cell lysate. Proteins were visualized by cCBB staining and analyzed by mass spectrometry. (F) Spindly immunoprecipitates were probed for ZW10 (top two panels) or Rod and dynamitin (bottom panels).
Figure 2.
Figure 2.
Spindly levels on kinetochores are reduced upon microtubule attachment. HeLa cells were treated with 100 μM monastrol for 12 h or transfected with 50 nM CDCA5 or SGO1 siRNA for 24 h before fixation and immunostaining for DNA, kinetochores (blue), Spindly (red), and tubulin (green). Confocal image stacks taken on a Leica SP5 microscope were deconvoluted and fluorescence signals measured along microtubules attached to a kinetochore. Signals of tubulin (green), CREST (blue), and Spindly (red) of kinetochores interacting with microtubules were measured by line scans and are displayed as line plots of mean intensities of three microtubule–kinetochore junctions each. Size bar, 10 μm.
Figure 3.
Figure 3.
Spindly RNAi affects spindle morphology. (A) HeLa cells transfected with Spindly siRNA for 36 h stained for DNA (blue), kinetochores (red), tubulin (green), and pericentrin (yellow). Images show maximum intensity projections (MIPs) of deconvoluted confocal z-stacks (step size, 120 nm). PM, prometaphase; M, metaphase; T, twisted spindle; MP, multipolar spindle; L, elongated spindle. (B) Spindle length in control, Spindly, and Spindly+hKid siRNA-transfected cells (48 h) was calculated as the distance between the pericentrin stained poles in z-stacks (mean, ± 95% confidence interval). (C) HeLa cells transfected with control, Spindly, and Spindly+hKid siRNA for 36 h before addition of 100 μM monastrol for 12 h. Cells were stained and imaged as in A, and average distances of kinetochores to the spindle pole in a total of 60 cells in three independent experiments per treatment were measured (mean ± SE). (D) U2OS H2B-GFP/Cherry-tubulin cells were transfected with Spindly siRNA for 36 h, and images were taken every 5 min over 10 h. Size bar, 10 μm. Time = h:min. Arrows indicate direction of spindle rotation.
Figure 4.
Figure 4.
Spindly RNAi effects depend on ZW10. (A) CenpB-YFP–expressing cells were either transfected with 50 nM control or Spindly, ZW10-specific siRNAs or a combination of both. Thirty-six hours after transfection mitotic cells were monitored using live cell fluorescence imaging, taking images every 30 s. Arrows, slowly congressing; arrowheads, fast congressing chromosomes. Scale bar, 10 μm.(B) HeLa cells transfected with siRNAs for Spindly, ZW10, or DHC, alone or in combination were fixed 48 h after transfection, stained, and imaged as in A. Shown are maximum intensity projections (MIPs) of representative ZW10, ZW10+Spindly, DHC, and DHC+Spindly siRNA-transfected arrested cells stained for tubulin (green), kinetochores (red), pericentrin (yellow), and DNA (blue). (C) Mitotic index and phases were determined by visual inspection, and classification of images of fixed cells stained as in (B) taken on an a Axiovert200M widefield microscope with a 40× Plan Neofluar0.75 NA objective in three independent experiments with total cell numbers indicated in parentheses. (D) The same images were analyzed for spindle morphology according to the defined main phenotypes (see text), and the frequency of multipolar and long or twisted spindles shown in relation to the total number of mitotic cells was analyzed.
Figure 5.
Figure 5.
Spindly depletion affects ZW10 but not MAD2. (A) Live cell confocal imaging of YFP-ZW10 expressing U2OS cell. Arrowheads point to paired YFP-ZW10 signals at kinetochores. The circle indicates the bleaching area. Scale bar, 1 μm. Fluorescence intensities were recorded on 26 kinetochores in control and 36 in Spindly RNAi cells. The mean values of double normalization pixel intensities were plotted as a function of time. (B) HeLa cells were transfected with control and Spindly siRNAs for 48 h and stained for DNA (Hoechst), kinetochores (CREST, blue), microtubules (tubulin, green), and ZW10 (red) and imaged on a Leica SP5 microscope. Arrow, a kinetochore of a noncongressed; arrowhead, a kinetochore of a congressed chromosome. (C) HeLa cells were transfected as in B and stained for DNA, microtubules, kinetochores, and MAD2. Top panel, a control metaphase cell. MAD2 signals were contrast enhanced as indicated by the gray scale bar. Bottom panel, arrows point to an unattached kinetochore with crescent MAD2 staining. Scale bar, 10 μm. (D) Control and Spindly RNAi HeLa cells stained for MAD2, Spindly, kinetochores, and DNA were imaged on a Zeiss LSM510 microscope. Background-corrected kinetochore signals of aligned and not aligned chromosomes in control and Spindly RNAi cells (mean ± SE).
Figure 6.
Figure 6.
Identification of Spindly domains required for kinetochore binding. HeLa cells were transfected with expression plasmids for FLAG-epitope–tagged wild-type and Spindly mutants for 24 h, methanol-fixed, and stained for DNA (Hoechst, red) and for overexpressed Spindly using anti-FLAG-antibody (SPDLY, green). Images were taken on a Leica SP5 confocal microscope using a 63× HCX PL APO lambda blue, 1.4 NA objective. Size bar, 10 μm.
Figure 7.
Figure 7.
Removal of Spindly is required for silencing of the mitotic checkpoint. (A) HeLa H2B-GFP–expressing cells were transfected with expression plasmids for FLAG-epitope–tagged wild-type, ΔQQ, NΔ253, and ΔSB Spindly along with an RFP expression vector for 36 h. Red fluorescent cells were monitored for progression through mitosis by live cell imaging. Selected image frames of Movies 14–17 are shown. Time = h:min. Scale bar, 10 μm. (B) HeLa cells transfected for 24 h with FLAG-epitope–tagged wild-type, NΔ253 and ΔSB Spindly were methanol-fixed and stained using anti-FLAG antibody (Spindly, green) antibodies specific for ZW10, DHC1, or MAD2 (red), and Hoechst dye (DNA, blue). Arrowheads, kinetochores of aligned chromosomes positive for Spindly mutants and ZW10; arrows, colocalization of Spindly mutants and MAD2. Scale bar, 10 μm.

References

    1. Ashar H. R., James L., Gray K., Carr D., Black S., Armstrong L., Bishop W. R., Kirschmeier P. Farnesyl transferase inhibitors block the farnesylation of CENP-E and CENP-F and alter the association of CENP-E with the microtubules. J. Biol. Chem. 2000;275:30451–30457. - PubMed
    1. Basto R., Scaerou F., Mische S., Wojcik E., Lefebvre C., Gomes R., Hays T., Karess R. In vivo dynamics of the rough deal checkpoint protein during Drosophila mitosis. Curr. Biol. 2004;14:56–61. - PubMed
    1. Busson S., Dujardin D., Moreau A., Dompierre J., De M., Jr Dynein and dynactin are localized to astral microtubules and at cortical sites in mitotic epithelial cells. Curr. Biol. 1998;8:541–544. - PubMed
    1. Carminati J. L., Stearns T. Microtubules orient the mitotic spindle in yeast through dynein-dependent interactions with the cell cortex. J. Cell Biol. 1997;138:629–641. - PMC - PubMed
    1. Chan G. K., Jablonski S. A., Starr D. A., Goldberg M. L., Yen T. J. Human Zw10 and ROD are mitotic checkpoint proteins that bind to kinetochores. Nat. Cell Biol. 2000;2:944–947. - PubMed

Publication types

MeSH terms

LinkOut - more resources