. 2010 Jul;104(1):179-88.
doi: 10.1152/jn.00198.2010. Epub 2010 Apr 28.

Magnetoencephalography demonstrates multiple asynchronous generators during human sleep spindles

Affiliations

Magnetoencephalography demonstrates multiple asynchronous generators during human sleep spindles

Nima Dehghani et al. J Neurophysiol. 2010 Jul.

Abstract

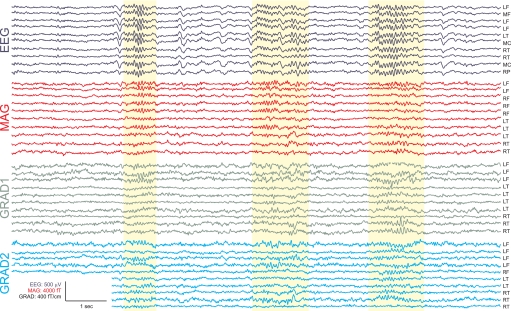
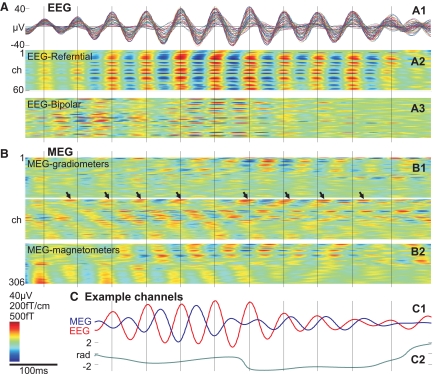
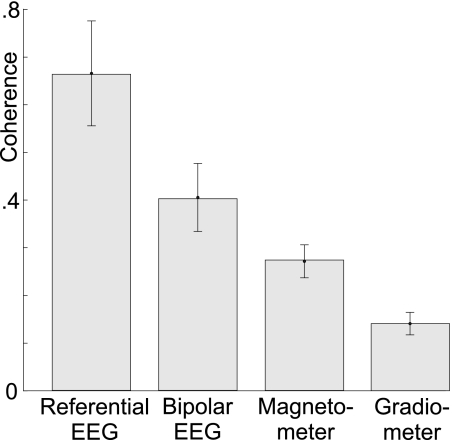
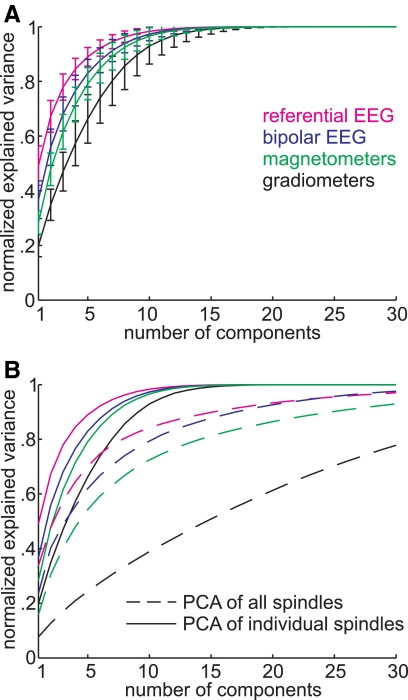
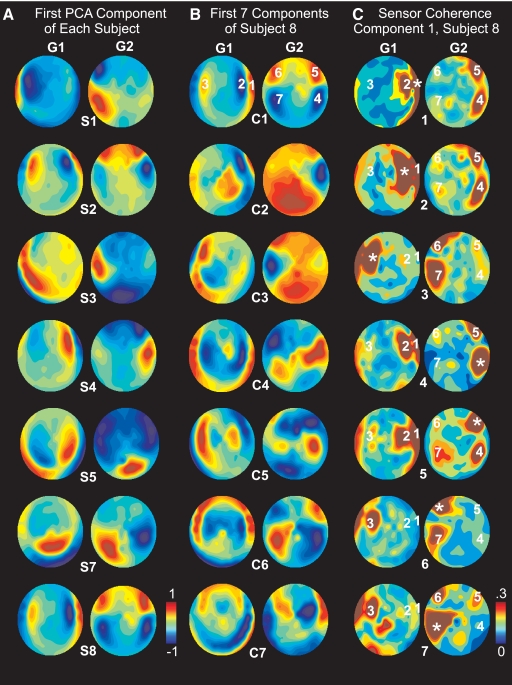
Sleep spindles are approximately 1 s bursts of 10-16 Hz activity that occur during stage 2 sleep. Spindles are highly synchronous across the cortex and thalamus in animals, and across the scalp in humans, implying correspondingly widespread and synchronized cortical generators. However, prior studies have noted occasional dissociations of the magnetoencephalogram (MEG) from the EEG during spindles, although detailed studies of this phenomenon have been lacking. We systematically compared high-density MEG and EEG recordings during naturally occurring spindles in healthy humans. As expected, EEG was highly coherent across the scalp, with consistent topography across spindles. In contrast, the simultaneously recorded MEG was not synchronous, but varied strongly in amplitude and phase across locations and spindles. Overall, average coherence between pairs of EEG sensors was approximately 0.7, whereas MEG coherence was approximately 0.3 during spindles. Whereas 2 principle components explained approximately 50% of EEG spindle variance, >15 were required for MEG. Each PCA component for MEG typically involved several widely distributed locations, which were relatively coherent with each other. These results show that, in contrast to current models based on animal experiments, multiple asynchronous neural generators are active during normal human sleep spindles and are visible to MEG. It is possible that these multiple sources may overlap sufficiently in different EEG sensors to appear synchronous. Alternatively, EEG recordings may reflect diffusely distributed synchronous generators that are less visible to MEG. An intriguing possibility is that MEG preferentially records from the focal core thalamocortical system during spindles, and EEG from the distributed matrix system.


Figures

Fig. 1.
Fig. 1.
Example spindles. Selected spindles in sample EEG and magnetoencephalogram (MEG) channels are highlighted in yellow. Complete recording profiles are shown in Supplementary Fig. S1. The greater variability in MEG spindles is obvious even in the raw recordings. L, left; M, middle; R, right; F, frontal; T, temporal; C, central; P, parietal.
Fig. 2.
Fig. 2.
Recording of a single spindle with EEG sensors (A), MEG sensors (B), and their relationship (C). A1: superimposed referential EEG waveforms from 60 scalp channels during a single spindle. A2: the same data in a time-intensity plot from referential and bipolar (A3) montages, where peaks and troughs, normalized to the largest channel, are obviously synchronous across the scalp. B: the EEG peaks, marked with vertical lines, have no regular relationship to the peaks of simultaneously recorded MEG spindles from 204 gradiometers (B1) and 102 magnetometers (B2). For this spindle, the mean coherence between Fz and the other 59 EEG ch was 0.82 and between Fz and the 306 MEG ch was 0.45. Arrows mark the peaks of an example MEG channel that initially precedes and later follows the EEG peaks (vertical lines). C1: waveforms of 2 of the largest amplitude EEG and MEG channels during the same spindle. Coherence between these 2 channels was 0.49. C2: instantaneous relative phase, calculated using the Hilbert transform, varies widely. Subject 2. For an example from another subject, see Supplementary Fig. S2.
Fig. 3.
Fig. 3.
Within-modality coherence. Bars and error bars are cross-subjects means and SD of the average coherence between all pairs of sensors in each modality. EEG shows a higher within-modality coherence in comparison to MEG. In each modality, referential recordings show a higher degree of coherence than bipolar recordings (i.e., bipolar EEG is less coherent than referential EEG, and gradiometers are less coherent than magnetometers).
Fig. 4.
Fig. 4.
Spatiotemporal complexity in each modality evaluated with principal coaponent Analysis (PCA) of spindles. For each sensor modality, PCA was calculated and the variance of the data explained by increasing number of PCA components is plotted. A: cumulative sum of variance explained by PCA components calculated on 85 individual spindles in 7 subjects. PCA based on gradiometers (black lines) required the largest number of components to explain the data variance and referential EEG (magenta) the fewest. Bipolar EEG (navy blue) and magnetometer (green) gave intermediate values. Error bars indicate SD. B: comparison between PCA components that are calculated for individual spindles and applied to the same spindle (solid line, same procedure as in A) vs. PCA calculated on all spindles concatenated together and applied to each spindle separately (dashed line). Gradiometers are especially sensitive to the later process, which indicates that different spindles in a given subject have different spatiotemporal patterns.
Fig. 5.
Fig. 5.
Distributed coherent networks of MEG generators. A: topographical maps of the factor loadings for the first PCA factor for each subject (S1, S2 … S8). Factor loadings represent the contribution of each sensor to the PCA component. Separate maps are shown for the orthogonal planar gradiometers: grad1 (G1) and grad2 (G1). PCA factors were derived using grad1 and grad2 recordings after concatenating all spindles in a given subject (i.e., factors were chosen to account for the variance across all spindles simultaneously). Because gradiometer signals are maximal over their generating cortex, these maps may be interpreted as indicating the likely lobe and hemisphere of the variance underlying each indicated PCA factor. B: topographical maps of the factor loadings for the 1st 7 PCA factors (C1, C2 … C7) for subject 8. C: coherence maps in subject 8. The 7 sensors with the peak factor loadings in the 1st principle component were chosen as seeds (marked in the top row of B), and the coherence map was calculated to each seed as indicated by the * on each plot.

References

    1. Achermann P, Borbely AA. Temporal evolution of coherence and power in the human sleep electroencephalogram. J Sleep Res 7Suppl. 1: 36–41, 1998 - PubMed
    1. Anderer P, Klosch G, Gruber G, Trenker E, Pascual-Marqui RD, Zeitlhofer J, Barbanoj MJ, Rappelsberger P, Saletu B. Low-resolution brain electromagnetic tomography revealed simultaneously active frontal and parietal sleep spindle sources in the human cortex. Neuroscience 103: 581–592, 2001 - PubMed
    1. Andersen P, Andersson SA. Physiological Basis of the Alpha Rhythm. New York: Meredith, 1968
    1. Asano E, Mihaylova T, Juhasz C, Sood S, Chugani HT. Effect of sleep on interictal spikes and distribution of sleep spindles on electrocorticography in children with focal epilepsy. Clin Neurophysiol 118: 1360–1368, 2007 - PMC - PubMed
    1. Buzsaki G. Rhythms of the Brain. Oxford, UK: Oxford University Press, 2006

Publication types