. 2010 Jul;104(1):18-34.
doi: 10.1152/jn.00019.2010. Epub 2010 Apr 28.

Calcium balance and mechanotransduction in rat cochlear hair cells

Affiliations

Calcium balance and mechanotransduction in rat cochlear hair cells

Maryline Beurg et al. J Neurophysiol. 2010 Jul.

Abstract

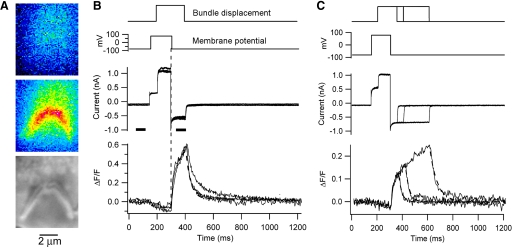
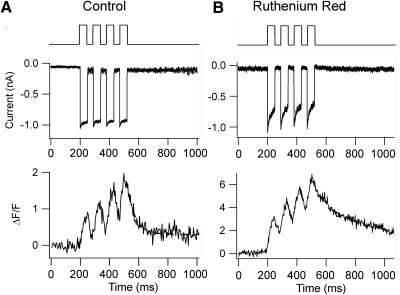
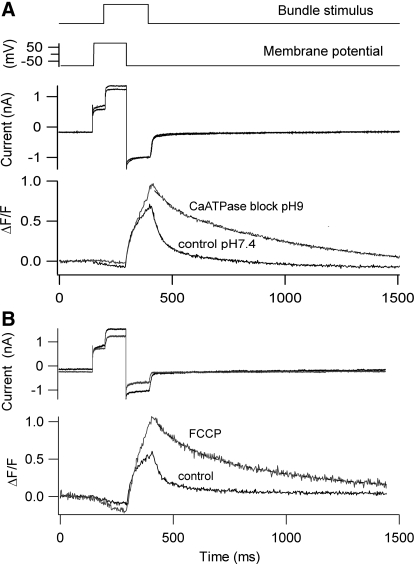
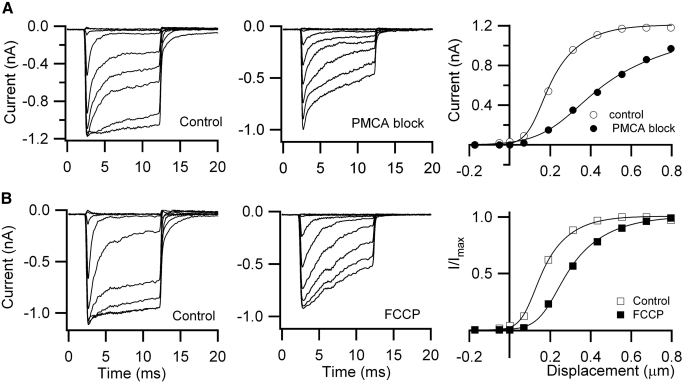
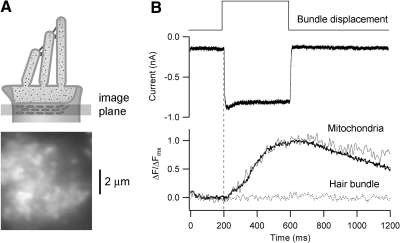
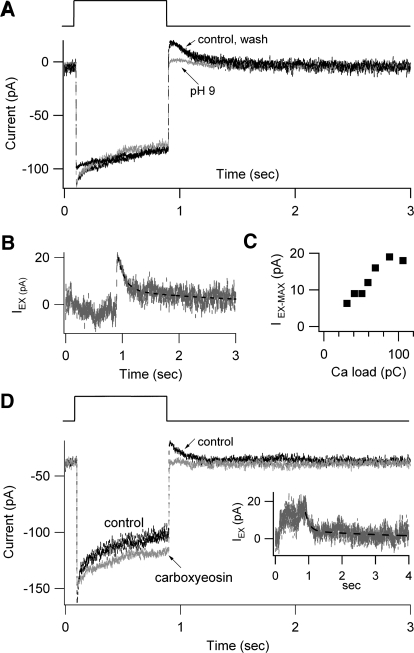
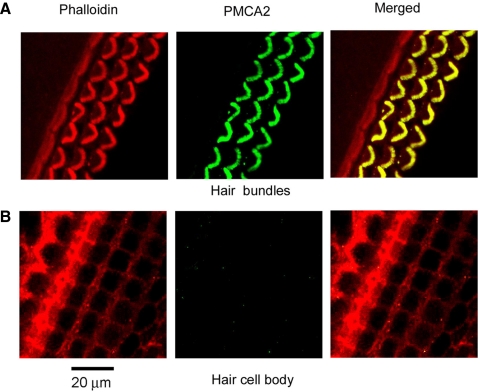
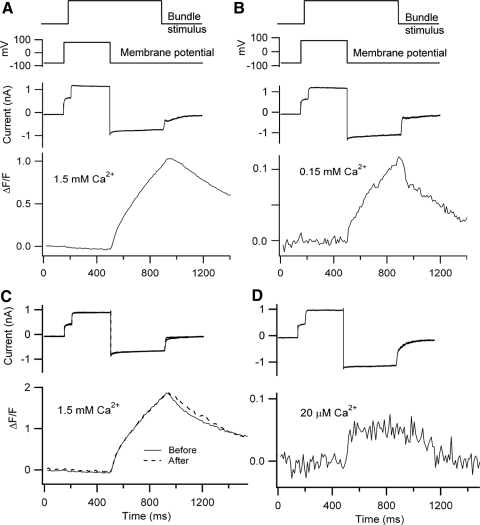
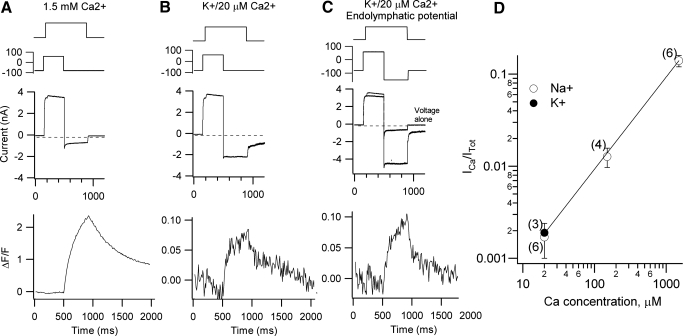
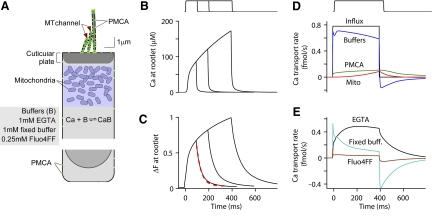
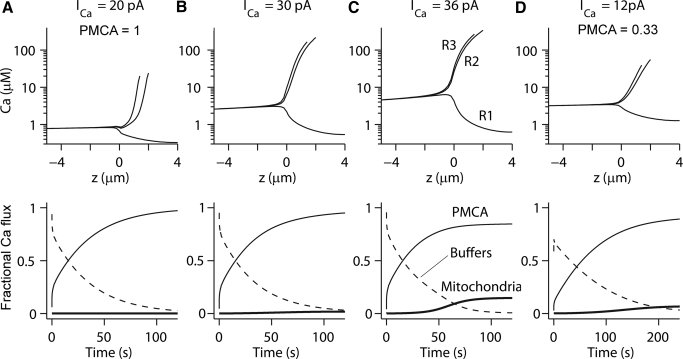
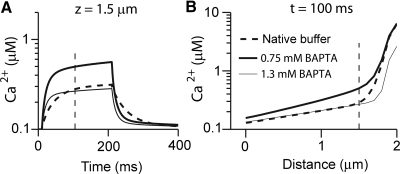
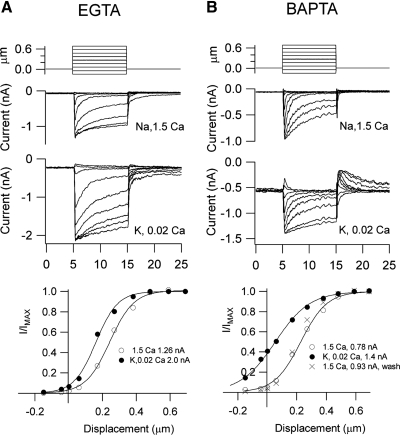
Auditory transduction occurs by opening of Ca(2+)-permeable mechanotransducer (MT) channels in hair cell stereociliary bundles. Ca(2+) clearance from bundles was followed in rat outer hair cells (OHCs) using fast imaging of fluorescent indicators. Bundle deflection caused a rapid rise in Ca(2+) that decayed after the stimulus, with a time constant of about 50 ms. The time constant was increased by blocking Ca(2+) uptake into the subcuticular plate mitochondria or by inhibiting the hair bundle plasma membrane Ca(2+) ATPase (PMCA) pump. Such manipulations raised intracellular Ca(2+) and desensitized the MT channels. Measurement of the electrogenic PMCA pump current, which saturated at 18 pA with increasing Ca(2+) loads, indicated a maximum Ca(2+) extrusion rate of 3.7 fmol x s(-1). The amplitude of the Ca(2+) transient decreased in proportion to the Ca(2+) concentration bathing the bundle and in artificial endolymph (160 mM K(+), 20 microM Ca(2+)), Ca(2+) carried 0.2% of the MT current. Nevertheless, MT currents in endolymph displayed fast adaptation with a submillisecond time constant. In endolymph, roughly 40% of the MT current was activated at rest when using 1 mM intracellular BAPTA compared with 12% with 1 mM EGTA, which enabled estimation of the in vivo Ca(2+) load as 3 pA at rest. The results were reproduced by a model of hair bundle Ca(2+) diffusion, showing that the measured PMCA pump density could handle Ca(2+) loads incurred from resting and maximal MT currents in endolymph. The model also indicated the endogenous mobile buffer was equivalent to 1 mM BAPTA.


Figures

Fig. 1.
Fig. 1.
Hair bundle calcium signals during transduction in outer hair cells (OHCs). A: hair bundle images showing average calcium fluorescence before (top) and during (middle) mechanotransducer (MT) channel opening; Nomarski view of bundle shown at bottom. B: hair bundle calcium signal for OHC in A. The stimulus was a depolarization followed by a hair bundle displacement evoked by a water jet stimulus, upon which calcium influx occurs when the cell was repolarized to −80 mV. Superimposed membrane currents and fluorescence responses (plotted as ΔF/F) are shown for 3 times (5, 10, and 15 min) after achieving the whole cell condition. Offsets for the 5 and 10 min delays are fitted with an exponential τOFF = 35 ms. τOFF was slightly slowed for a delay of 15 min. The fluorescence images in A acquired during times indicated by the horizontal bars below current traces. C: bundle calcium response vs. stimulus duration in another OHC repolarized to −80 mV. Note the fast and slow components of the response onset. Offset time constants (dashed lines) τOFF = 25 ms, 30 ms, and 53 ms. For both cells, extracellular solution contained 154 mM Na+, 1.5 mM calcium, and calcium indicator was 0.25 mM Fluo-4FF.
Fig. 2.
Fig. 2.
Effects of Ruthenium red (RR), a blocker of the mitochondrial uniporter, on OHC hair bundle Ca2+ signals. A: response to a train of four 50-ms bundle deflections of nearly 0.5 μm amplitude. Note the 2 components of the response, a series of fast transients with τON and τOFF of about 20 ms, superimposed on a slower calcium increase. Slow offset fitted with a single exponential (dashed line) of time constant 67 ms. B: after block of the uniporter with 1 μM RR, introduced via the patch pipette, the magnitude of the calcium responses, expressed as ΔF/F, was threefold larger and slower, indicating saturation of mobile calcium buffers. Offset fitted with a single exponential (dashed line) of time constant 313 ms. In both experiments, the camera was focused near the bottom of the hair bundle encompassing all 3 rows of stereocilia.
Fig. 3.
Fig. 3.
Effects of Ca2+ uptake and extrusion blockers on OHC hair bundle Ca2+ signals. A: effects of increasing the pH of the extracellular solution to 9.0 to block the plasma membrane Ca2+ ATPase (PMCA) pump, which requires H+ influx to exchange for Ca2+ efflux. This caused an increase in cytoplasmic calcium and a slowing of the recovery from bundle stimulation. B: extracellular perfusion of 1 μM carbonylcyanide p-trifluoromethoxyphenylhydrazone (FCCP), a protonophore that abolishes the mitochondrial membrane potential, increases cytoplasmic calcium, and slows the response to a bundle stimulus. In both A and B, the stimulus was a depolarization from −80 to +80 mV followed by a bundle displacement.
Fig. 4.
Fig. 4.
Factors affecting Ca2+ homeostasis also alter the current–displacement (I–X) relationship of the OHC transducer. A: mechanotransducer currents in response to bundle deflection, control (left), and high pH to block the PMCA pump (middle). Elevation of intracellular calcium due to block of the Ca-ATPase shifted the I–X relationship to the right and reduced its slope (sensitivity). B: mechanotransducer currents in response to bundle deflection, control (left), and 1 μM FCCP to block Ca2+ uptake into the mitochondria (middle). Elevation of intracellular Ca2+ due to block of the mitochondrial Ca2+ uptake shifted the I–X relationship to the right. In both A and B, the holding potential was −80 mV. I–X results were fitted with 2 Boltzmann components: I = IMAX/〈 1 + {exp[a1(X1X)]} × {1 + exp[a2(X1X)]}〉, where IMAX = 1.22 nA, a1 = 8.5 μm−1, X1 = 0.155 μm, a2 = 19 μm−1 (A, control); IMAX = 1.2 nA, a1 = 2.7 μm−1, X1 = 0.35 μm, a2 = 8 μm−1 (A, high pH); IMAX = 1.1 nA, a1 = 9.5 μm−1, X1 = 0.12 μm, a2 = 21 μm−1 (B, control); IMAX = 0.92 nA, a1 = 6.8 μm−1, X1 = 0.23 μm, a2 = 15 μm−1 (B, FCCP).
Fig. 5.
Fig. 5.
Ca2+ accumulation in mitochondria during hair bundle stimulation. A: imaging of mitochondrial belt after loading an OHC with Rhod2-AM. Fluorescence image shows region of cell viewed from above during patch recording. B: MT current and mitochondrial Ca2+ during bundle deflection. The thin trace is the response in a single cell; the thick trace is the average response over 5 different cells, scaled to the maximum increase in fluorescence. The dashed line represents imaging of the hair bundle where no fluorescence signal was detected.
Fig. 6.
Fig. 6.
Quantification of the PMCA pump rate from the exchange current IEX. A: MT currents to 0.6 μm hair bundle displacements before, during, and after increasing the pH of the saline around the bundle from 7.4 to 9.0 to block the PMCA pump. Three responses are superimposed: the pH 7.4 (control and wash) as black lines and the pH 9.0 (pump block) as gray. B: IEX, obtained by subtracting the pH 9.0 from the pH 7.4 in A. The decline in IEX after termination of the stimulus is fitted with 2 time constants of 128 ms and 2.2 s (dashed line). C: the IEX in 7 cells plotted against the Ca2+ load, obtained by integrating the MT current during the stimulus. For the 2 smallest Ca2+ loads, the hair bundle stimulus was 400 ms in duration, whereas that for the rest it was 800 ms. D: MT currents to 0.6 μm hair bundle displacements before (control) and several minutes after replacing the bath saline, with one containing 50 μM carboxyeosin diacetate succinimidyl ester to block the PMCA. Inset shows IEX, obtained by subtracting the test from the control in D. The decline in IEX is fitted with 2 time constants of 125 ms and 3.3 s (dashed line). All experiments were performed on P7 to P10 rats in salines in which the Na+ had been replaced by Tris so the MT current is carried mainly by Ca2+.
Fig. 7.
Fig. 7.
Immunofluorescence labeling for PMCA2 in rat neonatal organ of Corti. A: confocal section through the hair bundles labeled with phalloidin (left), anti-PMCA2 antibody (middle), and merged (right). Bundles of OHCs but not inner hair cells (IHCs) are strongly labeled. B: confocal section through cell bodies showing no PMCA2 labeling in P7 rat, from the base of the apical turn, the same cochlear region where the electrophysiological measurements were performed.
Fig. 8.
Fig. 8.
Hair bundle Ca2+ signals in reduced extracellular Ca2+ concentration. A: measurements in control 1.5 mM Ca2+ solution. B: responses in the same cell with 0.15 mM Ca2+ puffed on the bundle. C: measurements in another cell in control 1.5 mM Ca2+ solution before and after the test. D: responses with test solution containing 0.02 mM Ca2+. In both cells, the stimulus was a depolarization from −80 to +80 mV followed by a bundle displacement elicited by a fluid jet from a puffer pipette containing the requisite (1.5 mM Ca2+ or reduced Ca2+) solution. All fluorescence measurements were made with Fluo-4 as the calcium indicator. The timing of the bundle stimulus and depolarization apply to both cells. The Ca2+ signals in the lowest Ca2+ concentration were substantially attenuated despite an increase in the MT current.
Fig. 9.
Fig. 9.
Hair bundle Ca2+ signals in artificial endolymph (160 mM K+, 0.02 mM Ca2+). A: measurements in control (Na+, 1.5 mM Ca2+) solution. B: responses in artificial endolymph (160 mM K+, 0.02 mM Ca2+). C: responses in artificial endolymph (160 mM K+, 0.02 mM Ca2+), with the addition of a hyperpolarization to −150 mV to simulate the endolymphatic potential. The current response without the bundle stimulus is superimposed on that with the bundle deflection. Note the MT current amplitude is about 4 nA. The stimulus was a depolarization from −80 to +80 mV followed by a bundle displacement elicited by a fluid jet from a puffer pipette containing either Na+, 1.5 mM Ca2+ or K+, 0.02 mM Ca2+ solution. D: collected measurements of the fraction of MT current carried by Ca2+ (ICa/ITot) evaluated as described in the text and plotted against the extracellular Ca2+ concentration. Open symbols, extracellular Na+, intracellular Cs+; filled symbols with extracellular and intracellular K+. Numbers of experiments are given beside each point. The line is a straight line fit to the points.
Fig. 10.
Fig. 10.
Model of Ca2+ homeostasis in an OHC. A: components of the model: Ca2+ influx through MT channels, binding to fixed and mobile buffers, absorption by mitochondria, and extrusion via PMCA pump (filled circles). Note the pumps are concentrated in the stereocilia and virtually absent from the cell body. See methods for more details. B: simulated change in Ca2+ at the base of the bundle. C: change in fluorescence at the base of the bundle. The time course is slowed relative to B due to the Fluo-4FF dye and the averaging over the focal volume; offset time constant = 40 ms. Compare with Fig. 1C. D: contribution of the different factors, buffers, PMCA pumps, and mitochondria to absorbing Ca2+ entering. E: contribution of the different buffers, the high-affinity EGTA (KCa = 0.2 μM) absorbing most compared with the lower-affinity fixed buffer and dye (KCa = 10 μM).
Fig. 11.
Fig. 11.
Theoretical assessment of sustainable Ca2+ current through the MT channels. A: resting Ca2+ influx of 20 pA. Top: Ca2+ concentration along the 3 stereociliary rows as a function of distance z, from the base of the bundle (z = 0). Bottom: time course of contribution of the PMCA pump (thin line), buffers (dashed line), and mitochondria (thick line). B: for a resting calcium influx of 30 pA, almost all the Ca2+ was extruded, but there was a small accumulation in the mitochondria. This case is marginal. C: for a resting Ca2+ influx of 36 pA, only about 75% was extruded, the remainder accumulating in the mitochondria, which over prolonged timescale will become saturated. Simulations in A–C performed with a PMCA density of 6,000/μm2 (PMCA = 1). D: when the PMCA density was reduced to 2,000/μm2 (PMCA = 0.33), a sustained Ca2+ influx of 12 pA was now marginal and resulted in Ca2+ accumulation in the mitochondria. Individual stereociliary rows: R1, R2, and R3. All simulations with endogenous calcium buffer, 2 mM parvalbumin-β, and 0.25 mM calbindin-28K.
Fig. 12.
Fig. 12.
Theoretical comparison of native OHC calcium buffer with BAPTA. A: time courses of Ca2+ transient with different concentrations of BAPTA and with the native buffer as the mobile buffer at a position z = 1.5 μm from rootlet. B: Ca2+ gradients along the middle row stereocilium in the 3 buffers 100 ms after stimulus onset. The Ca2+ source, the MT channels, located at 2 μm. The mobile Ca2+ buffer in OHCs of posthearing rats is assumed to be 2 mM parvalbumin-β and 0.25 mM calbindin (Hackney et al. 2005). Based on the matches to the Ca2+ kinetics and the gradients along stereocilia, the native buffer is equivalent to 0.75 to 1.3 mM BAPTA.
Fig. 13.
Fig. 13.
MT currents in control and endolymph solutions with different exogenous calcium buffers. A: calcium buffer 1 mM EGTA. MT currents in response to bundle deflections with a stiff probe, current records (top), and I–X relationships (bottom) for control (Na+, 1.5 mM Ca2+) and endolymph (K+, 0.02 mM Ca2+). B: calcium buffer 1 mM BAPTA. MT currents in response to bundle deflections with a stiff probe, current records (top), and I–X relationships (bottom) for control (Na+, 1.5 mM Ca2+) and endolymph (K+, 0.02 mM Ca2+). Note that the endolymph solution increases the maximum current and shifts the I–X relationship in the negative direction. The shift is much larger with BAPTA, in which 40% of the current is activated at rest. In B, controls before (○) and after (X) low calcium perfusion (●). I–X results were fitted with a single Boltzmann: I = IMAX/〈1 + {exp[a1(X1X)]}〉, where IMAX = 1.26 nA, a1 = 14.1 μm−1, X1 = 0.24 μm (A, control); IMAX = 2.0 nA, a1 = 15.4 μm−1, X1 = 0.16 μm (A, endolymph); IMAX = 0.85 nA, a1 = 11.2 μm−1, X1 = 0.23 μm (B, control); IMAX = 1.4 nA, a1 = 9 μm−1, X1 = 0.05 μm (B, endolymph). Abscissa for current responses is time in milliseconds.

References

    1. Apicella S, Chen S, Bing R, Penniston JT, Llinás R, Hillman DE. Plasmalemmal ATPase calcium pump localizes to inner and outer hair bundles. Neuroscience 79: 1145–1151, 1997 - PubMed
    1. Ashmore JF, Ohmori H. Control of intracellular calcium by ATP in isolated outer hair cells of the guinea-pig cochlea. J Physiol 428: 109–131, 1990 - PMC - PubMed
    1. Babcock DF, Hille B. Mitochondrial oversight of cellular Ca2+ signaling. Curr Opin Neurobiol 8: 398–404, 1998 - PubMed
    1. Beal MF. Mitochondria take center stage in aging and neurodegeneration. Ann Neurol 58: 495–505, 2005 - PubMed
    1. Beurg M, Evans MG, Hackney CM, Fettiplace R. A large-conductance calcium-selective mechanotransducer channel in mammalian cochlear hair cells. J Neurosci 26: 10992–11000, 2006 - PMC - PubMed

Publication types

MeSH terms

LinkOut - more resources