. 2010 Apr 28;30(17):5912-26.
doi: 10.1523/JNEUROSCI.6456-09.2010.

Parallel input channels to mouse primary visual cortex

Affiliations

Parallel input channels to mouse primary visual cortex

Enquan Gao et al. J Neurosci. .

Abstract

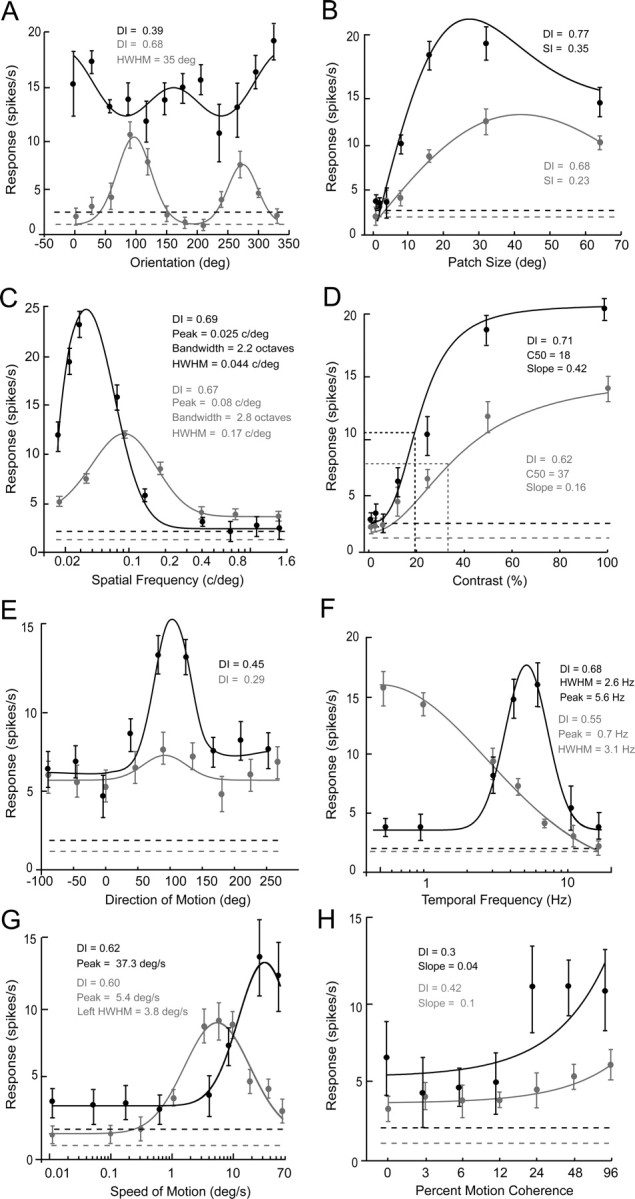
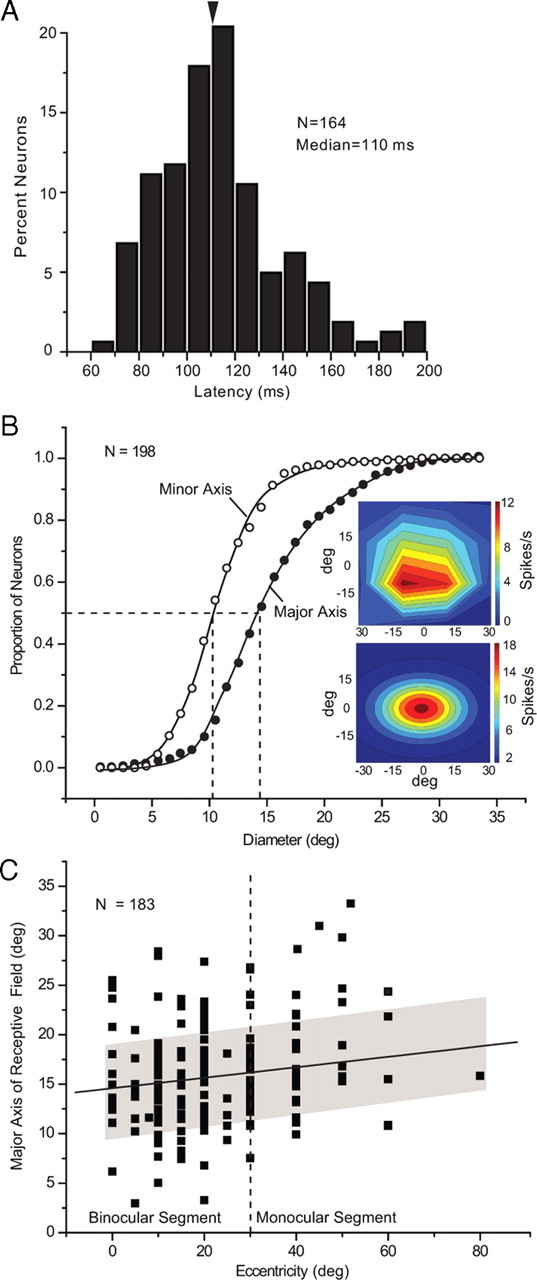
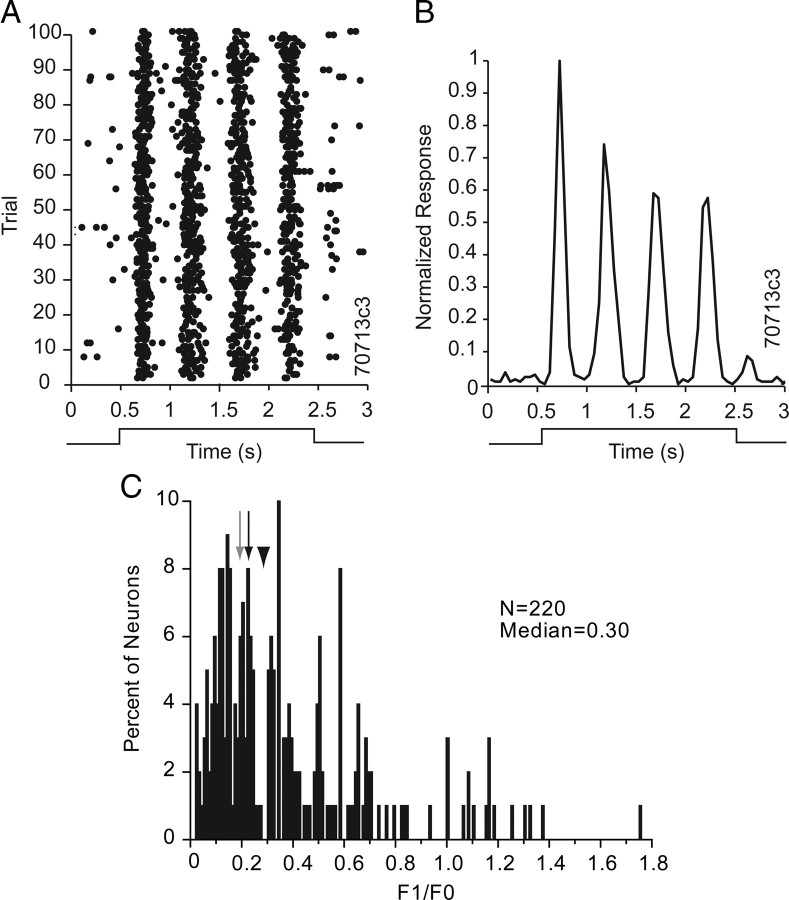
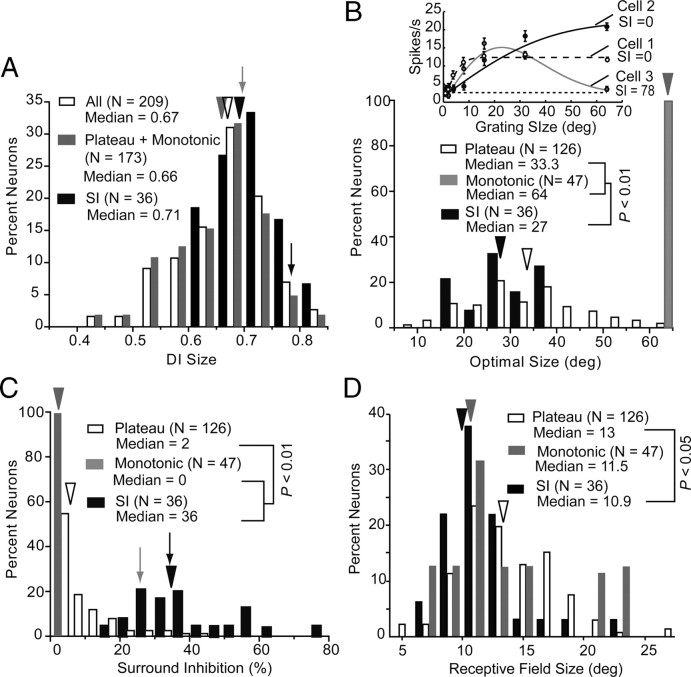
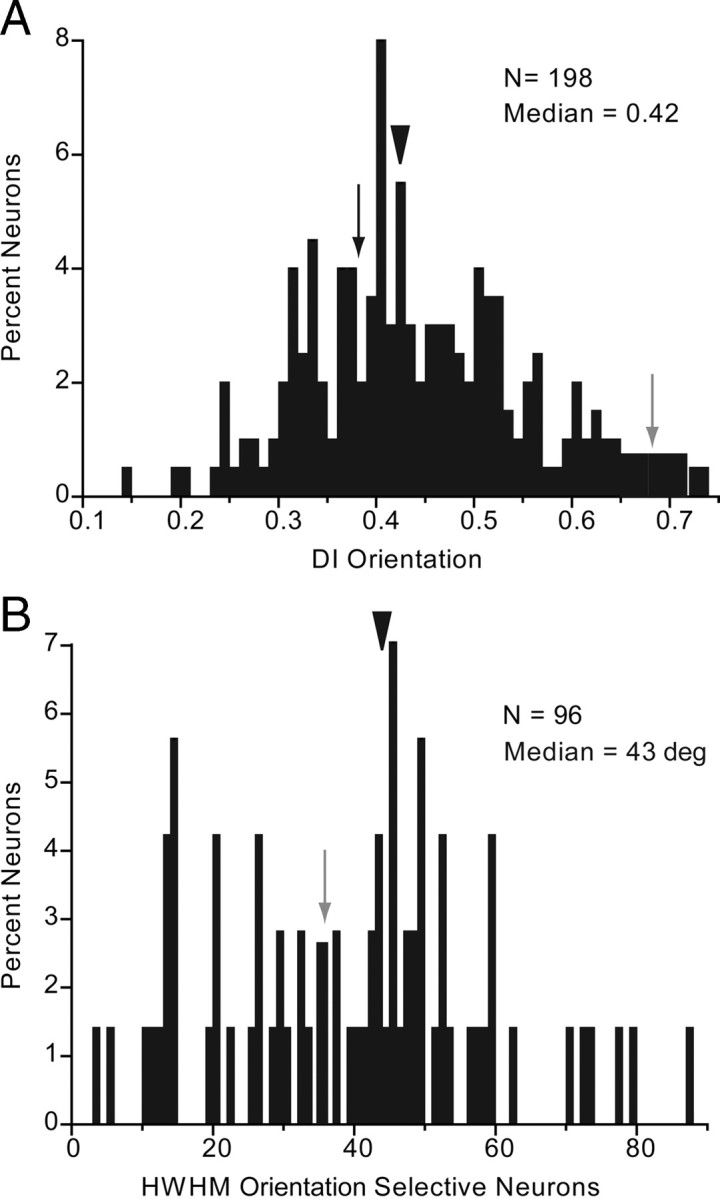
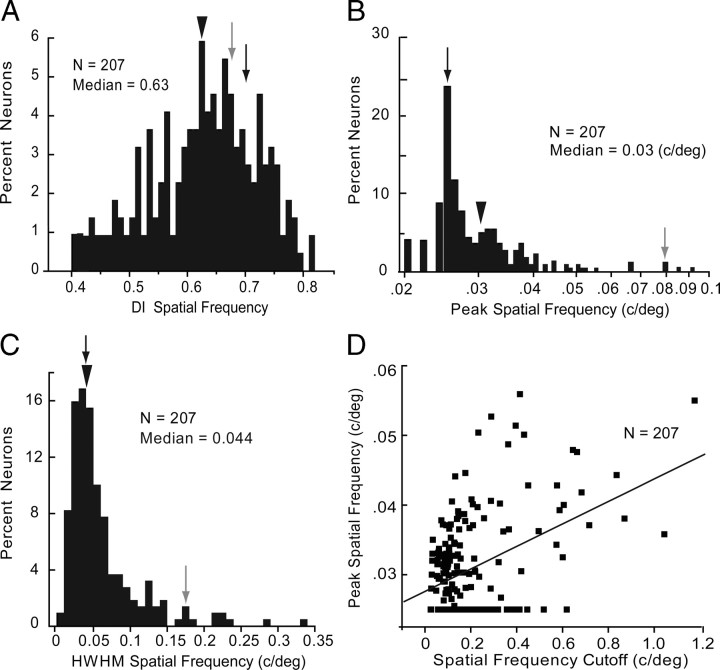
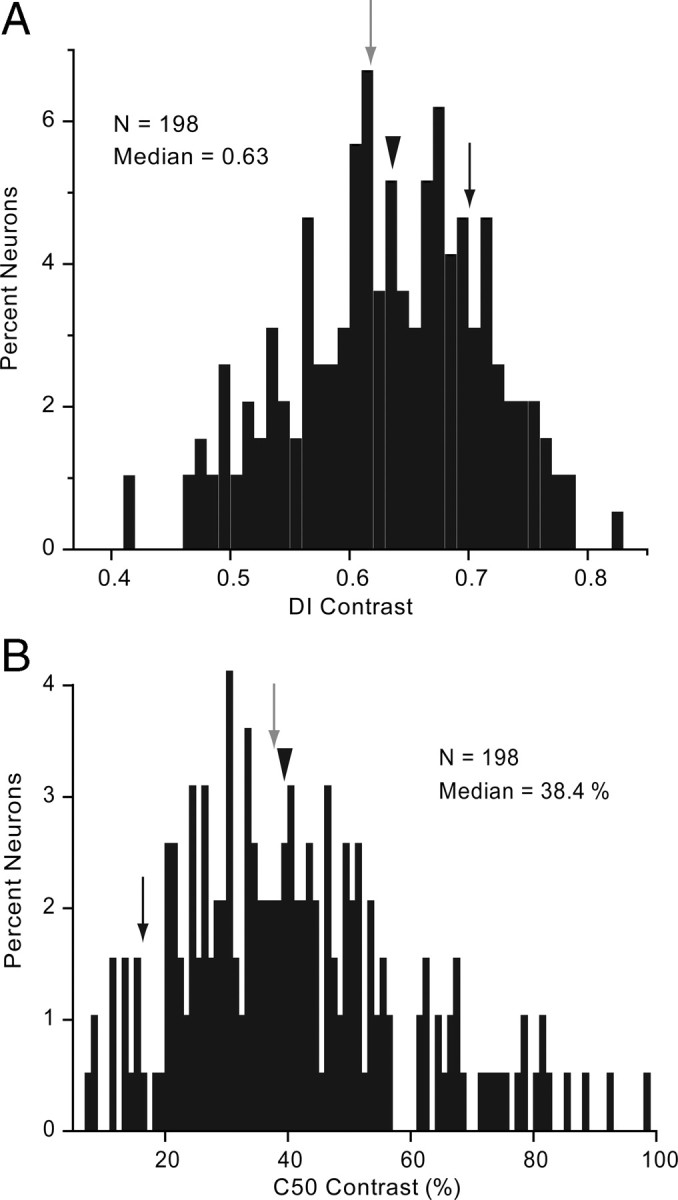
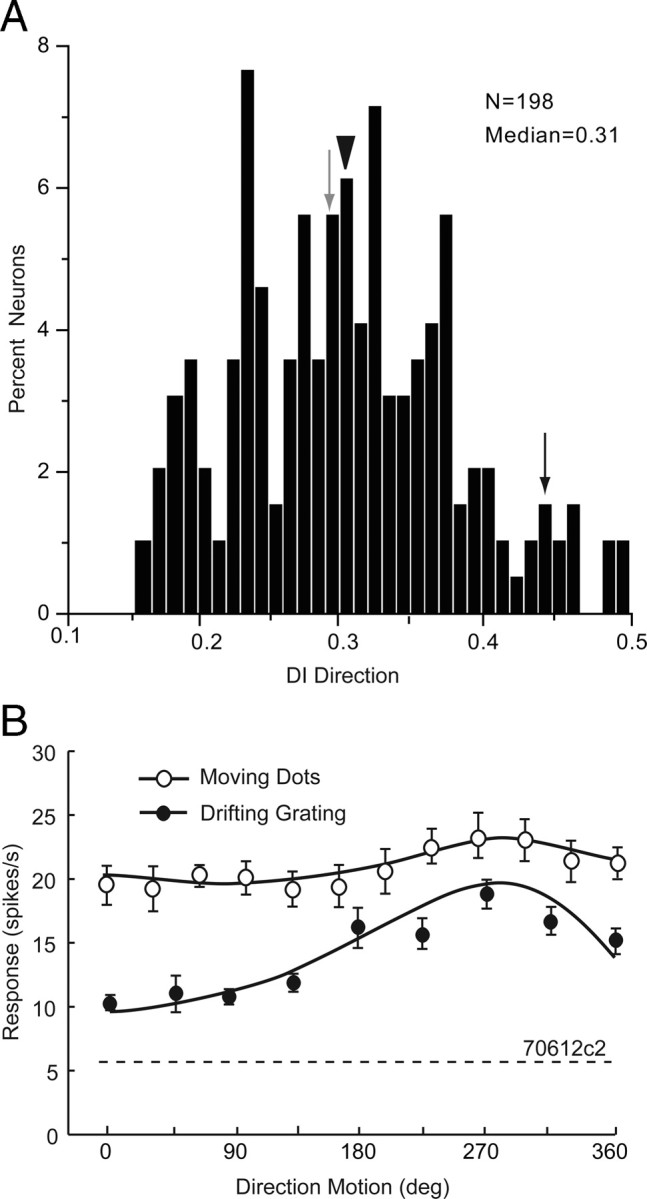
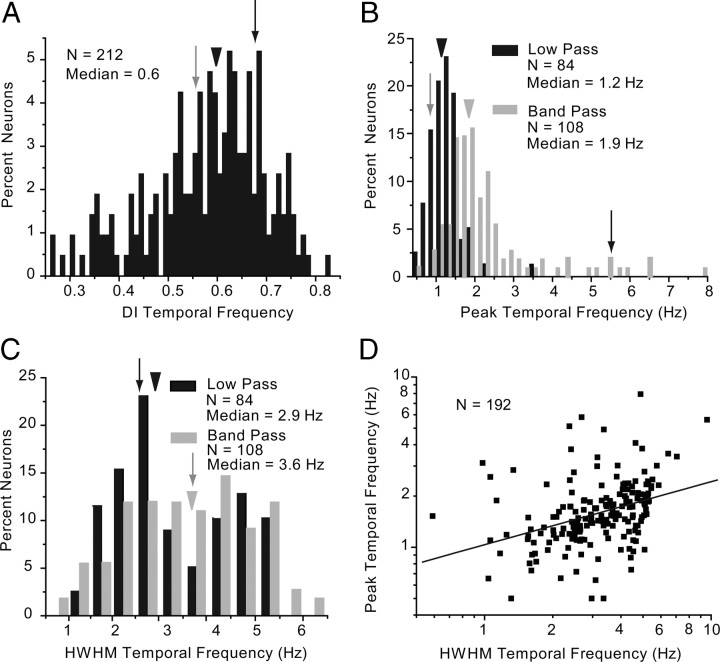
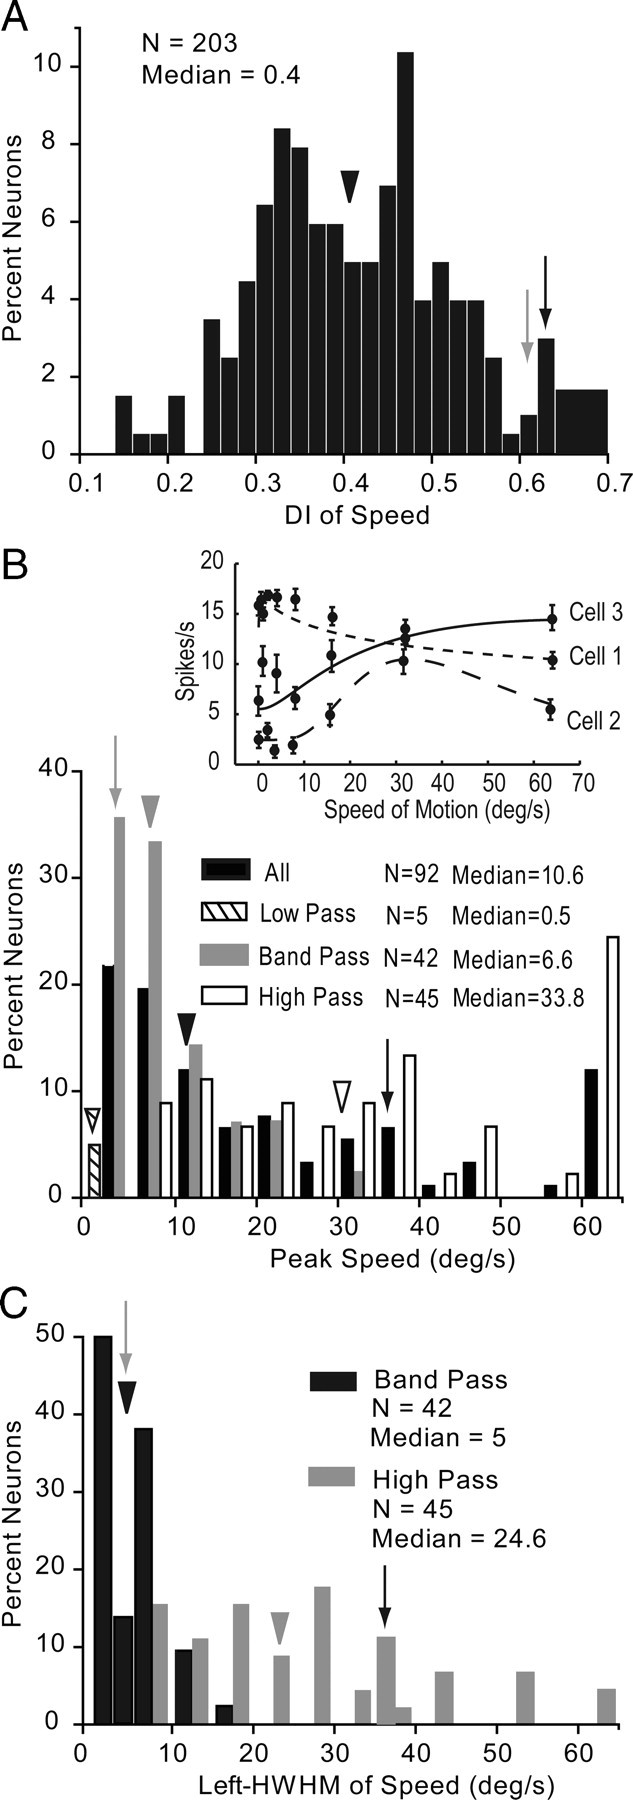
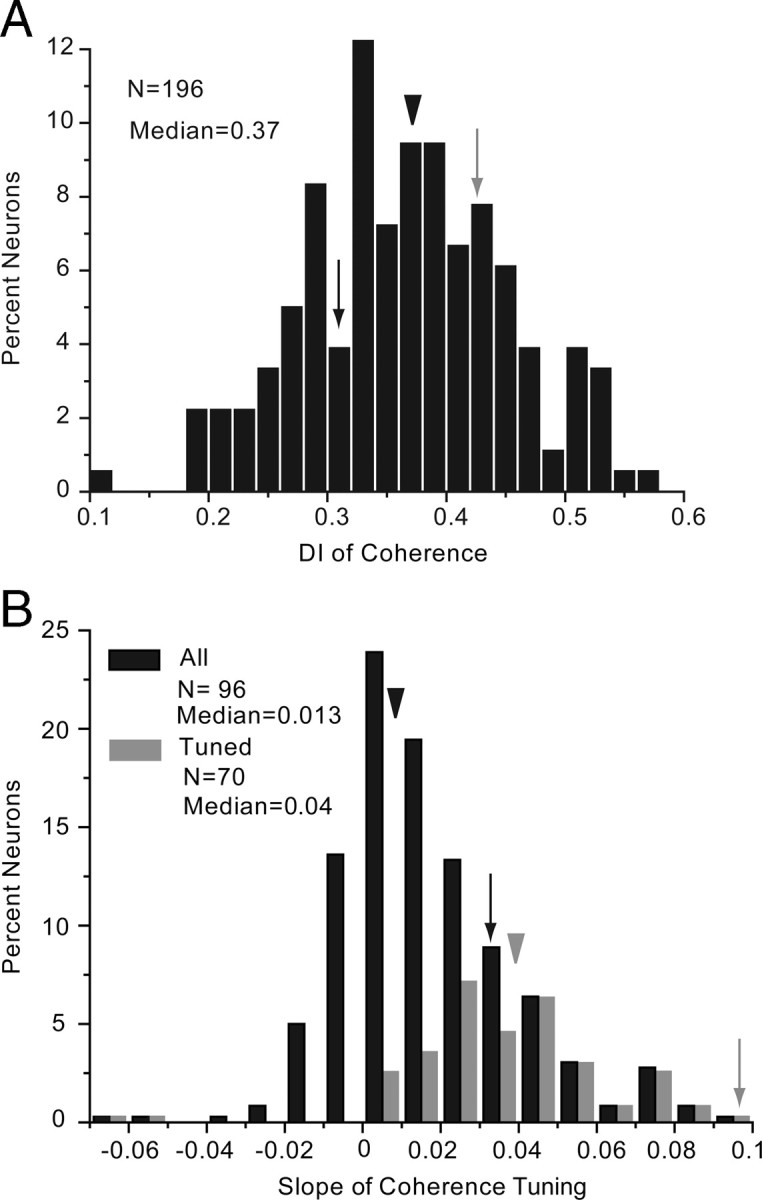
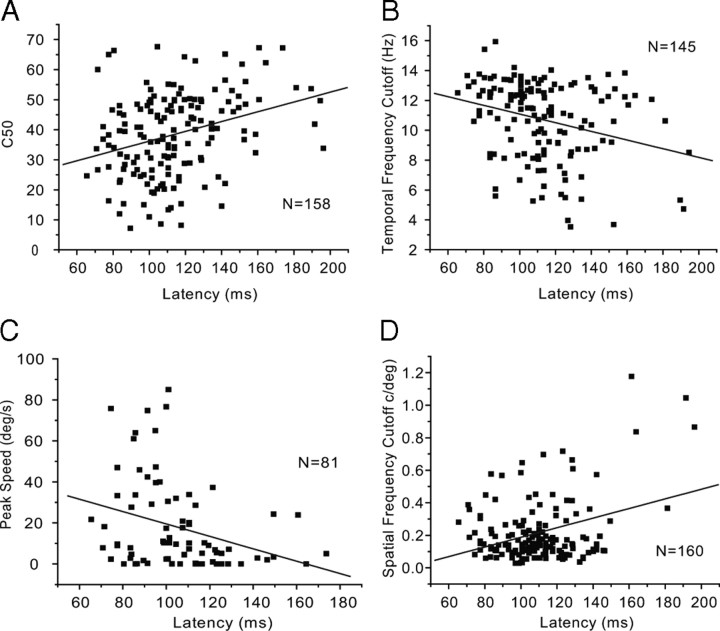
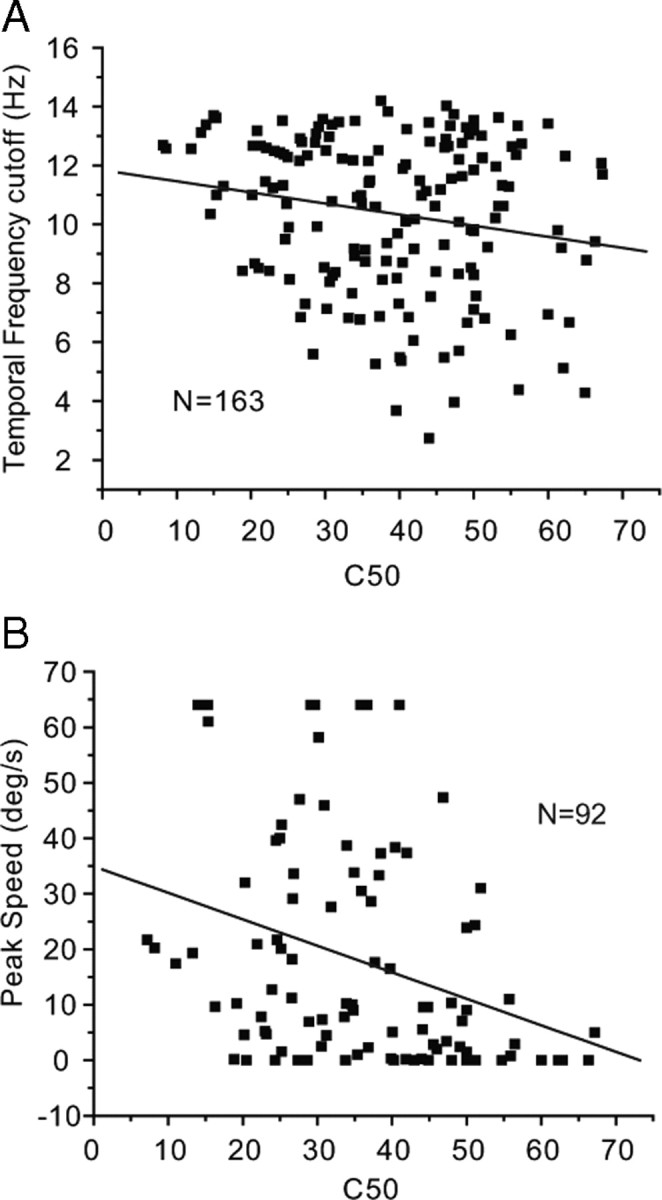
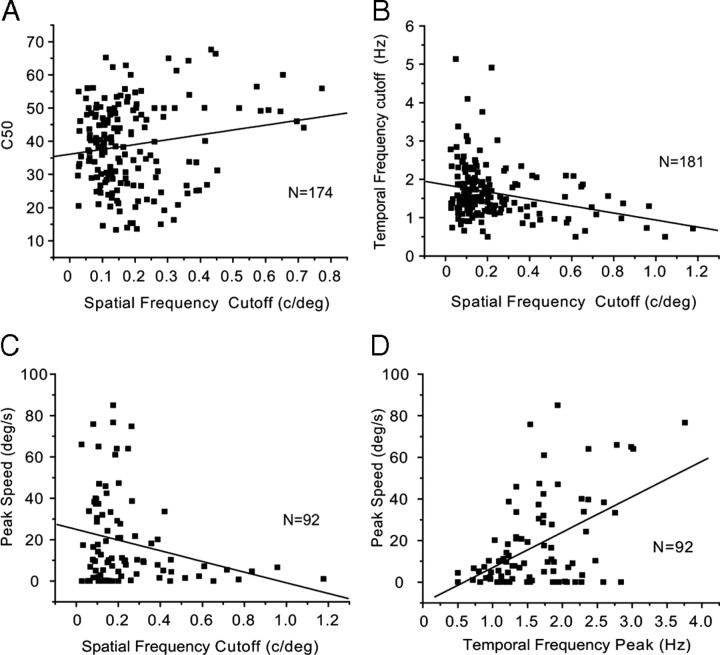
It is generally accepted that in mammals visual information is sent to the brain along functionally specialized parallel pathways, but whether the mouse visual system uses similar processing strategies is not known. It is important to resolve this issue because the mouse brain provides a tractable system for developing a cellular and molecular understanding of disorders affecting spatiotemporal visual processing. We have used single-unit recordings in mouse primary visual cortex to study whether individual neurons are more sensitive to one set of sensory cues than another. Our quantitative analyses show that neurons with short response latencies have low spatial acuity and high sensitivity to contrast, temporal frequency, and speed, whereas neurons with long latencies have high spatial acuity, low sensitivities to contrast, temporal frequency, and speed. These correlations suggest that neurons in mouse V1 receive inputs from a weighted combination of parallel afferent pathways with distinct spatiotemporal sensitivities.


Figures

Figure 1.
Figure 1.
Distinct combinations of spatiotemporal response properties in two neurons recorded in layer 2/3 of mouse V1. A–H, Tuning curves of the spike discharge of the gray (60601c2) and the black (60302c2) neuron elicited by visually stimulating the receptive field. In each panel the mean response (±SE) is plotted as a function of the relevant stimulus variable. Each data point is the mean of 10 stimulus repetitions. The solid lines indicate the best fitting functions. The dashed lines indicate the average spontaneous activity when no stimulus was presented within the receptive field. SI denotes surround inhibition index. C50 indicates the contrast at which the response magnitude is 50% of the peak. HWHM was measured on the left or the right side of the peak. Orientation (A), size (B), spatial frequency (C), contrast (D), and temporal frequency (F) tuning curves were obtained by stimulating with drifting sinusoidal gratings. Direction (E), speed (G), and coherence (H) tuning curves were obtained with moving random-dot stimuli. Notice that the gray neuron is optimally tuned to high spatial frequency, shows low contrast sensitivity, and prefers low temporal frequencies and slow speeds. In contrast, the black neuron is optimally tuned to low spatial frequency, is highly selective/sensitive to contrast, and prefers high temporal frequencies and fast speeds.
Figure 2.
Figure 2.
Response latencies and receptive field shape of V1 neurons. A, Distribution of response latency across all layers of V1. B, Cumulative histogram of major and minor axes of receptive fields in V1. Insets show heat maps of spike rate outlining a representative receptive field. Raw data (top), after smoothing with Gaussian function (bottom). C, Dependence of receptive field size (major axis) on eccentricity. Shading indicates SD.
Figure 3.
Figure 3.
Spatial summation of V1 receptive fields. A, Raster plot showing the modulation of firing due to stimulation with a drifting sinusoidal grating (0.25 c/deg) at 2 Hz. B, Normalized spike frequency plot of the neuron shown in A. The cell shows linear summation properties with an F1/F0 ratio of 1.39. C, Distribution of F1/F0 across the population of V1 neurons. In the majority of neurons the F1/F0 ratio is <1, indicating nonlinear summation properties, a characteristic of complex cells. The median F1/F0 is indicated by an arrowhead. The gray arrow corresponds to the gray neuron shown in Figure 1. The black arrow refers to the black neuron shown in Figure 1.
Figure 4.
Figure 4.
Size tuning of V1 neurons. A, Distribution of size DI across all V1 neurons (open bars), neurons with monotonically increasing or saturating tuning curves (gray bars), and surround-inhibited neurons (SI) are represented by black bars. Arrowheads with matching colors indicate median DI of the different groups of neurons. Solid arrow indicates DI of gray neuron shown in Figure 1B. Black arrow refers to neuron shown in Figure 1B. B, Distribution of optimal size. Inset shows representative examples of different size tuning curves: plateau (coarse dashes), monotonic (black), and surround inhibited (gray). The dashed line indicates the average spontaneous activity. C, Distribution of surround inhibition. D, Distribution of receptive field size. All conventions as in A.
Figure 5.
Figure 5.
Orientation tuning of V1 neurons. A, Distribution of orientation DI. Median DI is indicated by arrowhead. Gray and black arrows indicate DIs of neurons shown in Figure 1A. B, Tuning bandwidth indicates the HWHM. Gray arrow refers to gray neuron in Figure 1A.
Figure 6.
Figure 6.
Spatial frequency tuning of V1 neurons. A, Distribution of spatial frequency DI across V1 neurons. Arrowhead indicates median DI. Gray and black arrows indicate DIs of neurons shown in Figure 1C. B, Distribution of peak spatial frequency. Conventions as in A. C, Distribution of spatial frequency bandwidth indicated by HWHM. Conventions as in A. D, Positive significant (R2 = 0.39, p < 0.0001) correlation between tuning bandwidth and spatial frequency cutoff.
Figure 7.
Figure 7.
Contrast tuning of V1 neurons. A, Distribution of contrast DI. Arrowhead indicates median DI. Gray and black arrows points to DI of neurons shown in Figure 1D. B, Distribution of percentage contrast that elicits half-maximal response (C50). Conventions as in A.
Figure 8.
Figure 8.
Direction tuning of V1 neurons. A, Distribution of direction tuning DI. Arrowhead indicates median DI. Gray and black arrows point to DIs of neurons shown in Figure 1E. B, Representative example of direction tuning to moving random-dot pattern (black dots). The same neuron shows a flat direction tuning curve to moving sinusoidal grating (white dots). Stippled line indicates spontaneous firing rate.
Figure 9.
Figure 9.
Temporal frequency tuning of V1 neurons. A, Distribution of temporal frequency DI. Arrowhead indicates median DI. Gray and black arrows indicate DIs of neurons shown in Figure 1F. B, Peak temporal frequency of low-pass (black bars, black arrowhead indicates median) and bandpass (gray bars, gray arrowhead indicates median) neurons. Conventions as in A. C, Distribution of temporal frequency bandwidth indicated by the HWHM. Low-pass neurons and median HWHM are shown in black. Bandpass neurons are represented in gray. Conventions as in A. D, Positive significant (R2 = 0.37, p < 0.0001) correlation of temporal frequency HWHM and peak temporal frequency.
Figure 10.
Figure 10.
Speed tuning of V1 neurons. A, Distribution of speed DI. Arrowhead indicates median DI. Gray and black arrows indicate DIs of neurons shown in Fig. 1G. B, Peak speed of all (black bars), low-pass (hatched bars), bandpass (gray bars), and high-pass (white bars) neurons. Arrowhead with matching patterns indicates median across the respective population. Conventions as in A. C, Distribution of speed bandwidth indicated by the L-HWHM. Bandpass neurons (black bars) and high-pass neurons (gray bars) are shown. Conventions as in A.
Figure 11.
Figure 11.
Motion coherence tuning in V1. A, Distribution of coherence DI. Arrowhead indicates median DI. Gray and black arrows indicate DIs of the neurons shown in Figure 1H. B, Distribution of slope of coherence tuning derived from linear fits of the tuning curves. Black bars represent all neurons. Gray bars represent coherence-tuned neurons. Black and gray arrowheads indicate median DI for the corresponding populations, all other conventions as in A.
Figure 12.
Figure 12.
Correlations of contrast, temporal frequency, speed, and spatial frequency tuning with onset latency in V1. A, Short-latency neurons have significantly (R2 = 0.31, p < 0.001) higher contrast sensitivity (i.e., low C50). B, Short-latency neurons have significantly (R2 = −0.28, p = 0.005) higher temporal frequency cutoff. C, Short-latency neurons are optimally tuned to significantly (R2 = −0.31, p = 0.005) higher speeds. D, Short-latency neurons have significantly (R2 = 0.34, p < 0.0001) lower spatial frequency cutoff.
Figure 13.
Figure 13.
Correlations between contrast sensitivity, temporal frequency, and speed cutoff in V1. A, Neurons with higher contrast sensitivity (i.e., low C50) have significantly (R2 = 0.19, p = 0.015) higher temporal frequency cutoff. B, Neurons with higher contrast sensitivity are optimally tuned to significantly (R2 = −0.32, p = 0.001) higher speeds.
Figure 14.
Figure 14.
Correlations between spatial frequency, contrast sensitivity, temporal frequency, and speed in V1. A, Neurons with higher spatial frequency cutoff have significantly (R2 = 0.17, p = 0.03) lower contrast sensitivity (i.e., high C50). B, Neurons with higher spatial frequency cutoff have significantly (R2 = −0.27, p = 0.002) lower temporal frequency cutoff. C, Neurons with higher spatial frequency cutoff are optimally tuned to significantly (R2 = −0.25, p = 0.02) lower peak speeds. D, Neurons that are tuned to higher peak temporal frequencies prefer significantly (R2 = 0.49, p < 0.0001) higher speeds.

References

    1. Albrecht DG, Hamilton DB. Striate cortex of monkey and cat: contrast response function. J Neurophysiol. 1982;48:217–237. - PubMed
    1. Angelucci A, Bressloff PC. Contribution of feedforward, lateral ad feedback connections to the classical receptive field center and extra-classical receptive field surround of primate V1 neurons. Prog Brain Res. 2006;154:93–120. - PubMed
    1. Angelucci A, Sainsbury K. Contribution of feedforward thalamic afferents and corticogeniculate feedback to the spatial summation area of macaque V1 and LGN. J Comp Neurol. 2006;498:330–351. - PubMed
    1. Angelucci A, Levitt JB, Walton EJ, Hupe JM, Bullier J, Lund JS. Circuits for local and global signal integration in primary visual cortex. J Neurosci. 2002;22:8633–8646. - PMC - PubMed
    1. Antonini A, Fagiolini M, Stryker MP. Anatomical correlates of functional plasticity in mouse visual cortex. J Neurosci. 1999;19:4388–4406. - PMC - PubMed

Publication types

LinkOut - more resources