. 2010 Apr 28;30(17):6048-57.
doi: 10.1523/JNEUROSCI.5094-09.2010.

Dysregulation of dopamine transporters via dopamine D2 autoreceptors triggers anomalous dopamine efflux associated with attention-deficit hyperactivity disorder

Affiliations

Dysregulation of dopamine transporters via dopamine D2 autoreceptors triggers anomalous dopamine efflux associated with attention-deficit hyperactivity disorder

Erica Bowton et al. J Neurosci. .

Abstract

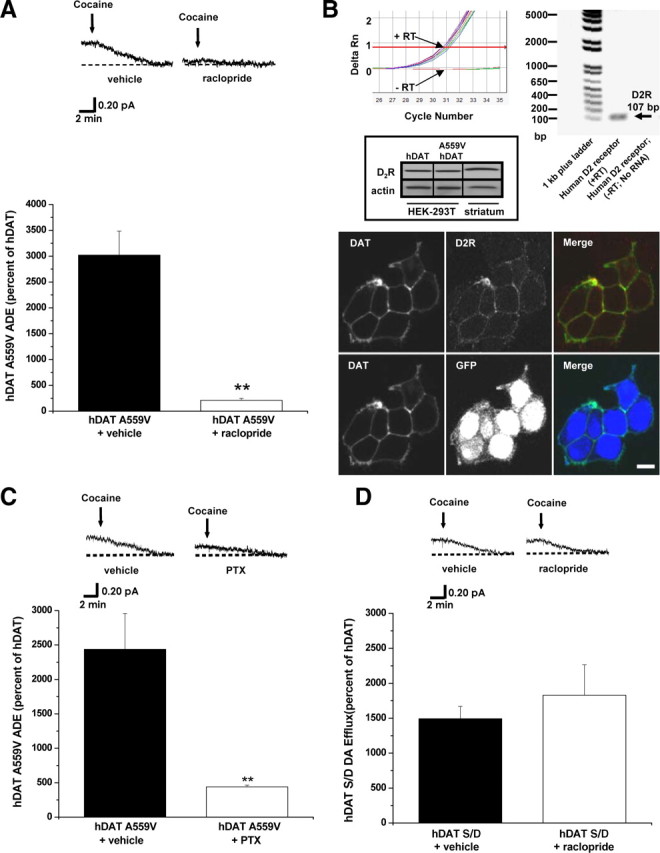
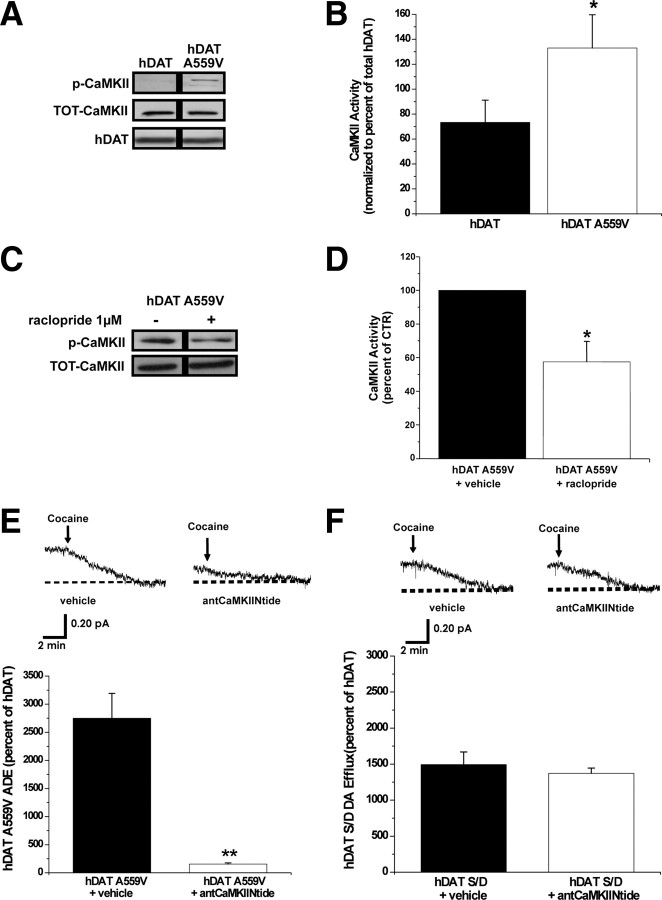
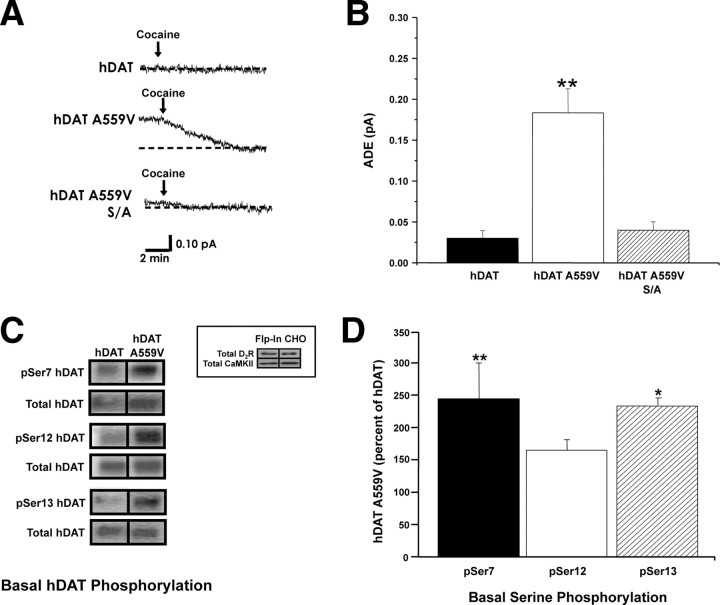
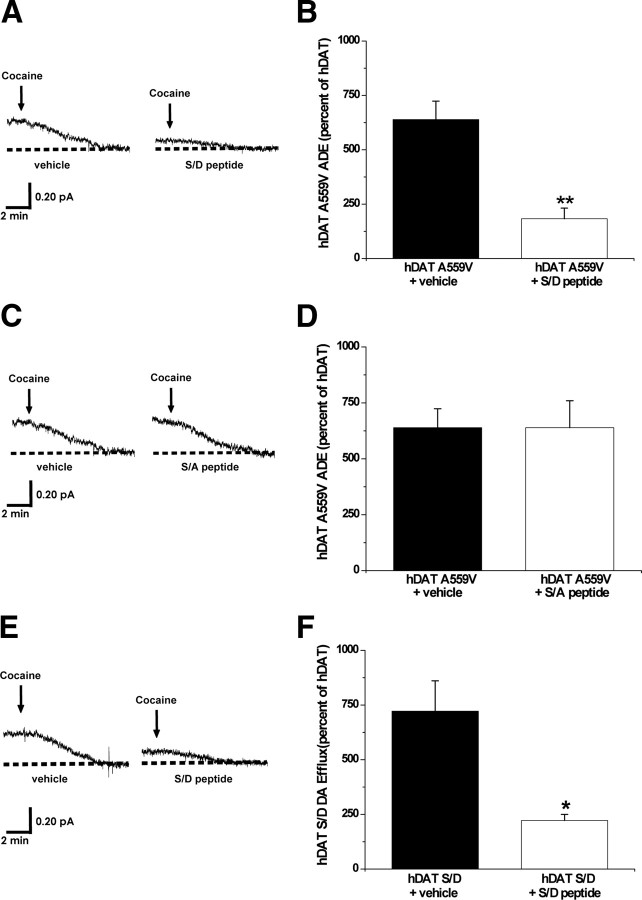
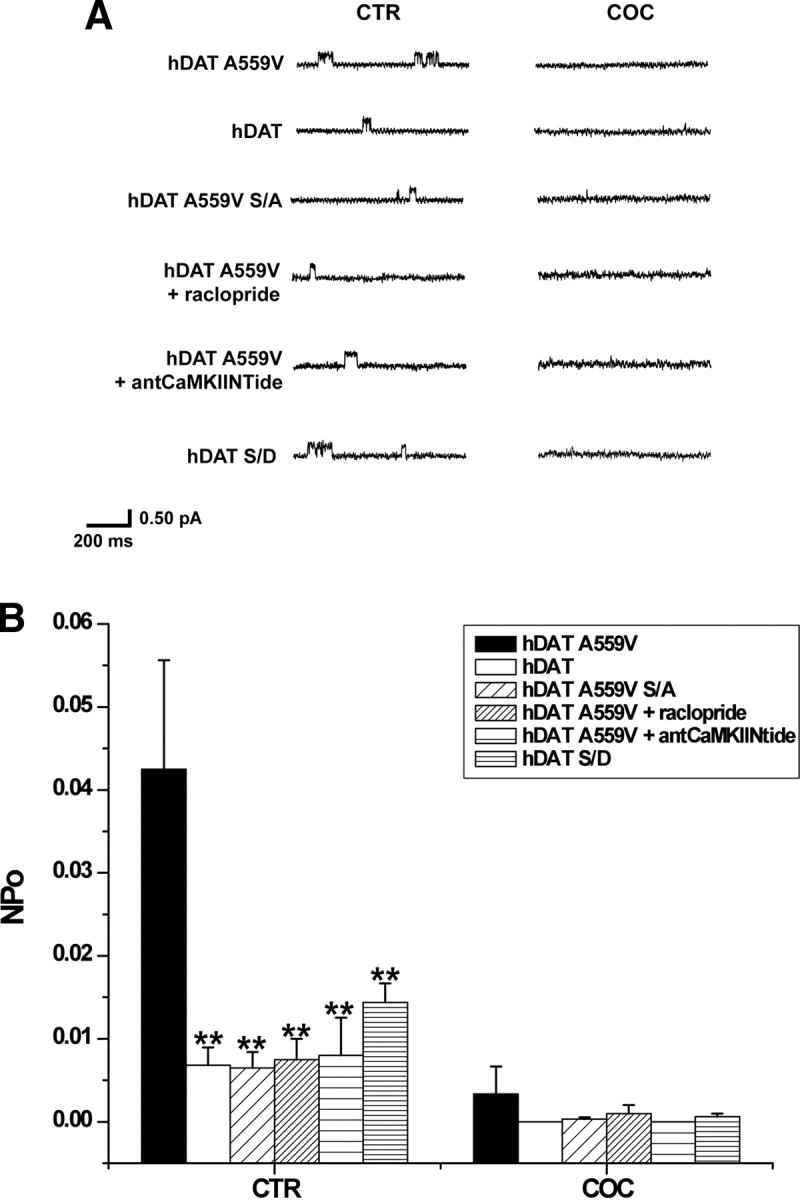
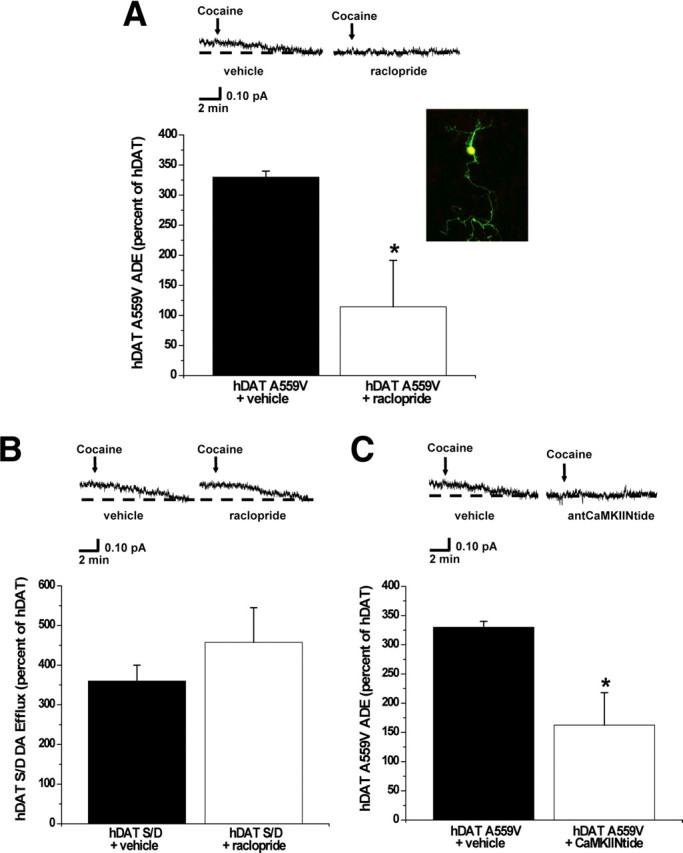
The neurotransmitter dopamine (DA) modulates brain circuits involved in attention, reward, and motor activity. Synaptic DA homeostasis is primarily controlled via two presynaptic regulatory mechanisms, DA D(2) receptor (D(2)R)-mediated inhibition of DA synthesis and release, and DA transporter (DAT)-mediated DA clearance. D(2)Rs can physically associate with DAT and regulate DAT function, linking DA release and reuptake to a common mechanism. We have established that the attention-deficit hyperactivity disorder-associated human DAT coding variant Ala559Val (hDAT A559V) results in anomalous DA efflux (ADE) similar to that caused by amphetamine-like psychostimulants. Here, we show that tonic activation of D(2)R provides support for hDAT A559V-mediated ADE. We determine in hDAT A559V a pertussis toxin-sensitive, CaMKII-dependent phosphorylation mechanism that supports D(2)R-driven DA efflux. These studies identify a signaling network downstream of D(2)R activation, normally constraining DA action at synapses, that may be altered by DAT mutation to impact risk for DA-related disorders.


Figures

Figure 1.
Figure 1.
D2R signaling sustains hDAT A559V-mediated ADE through a Gi/Go-dependent pathway. A, Top, Representative oxidative currents, filtered at 1 Hz, in hDAT A559V cells following pretreatment with vehicle (left) or 1 μm raclopride (right). Arrows indicate application of cocaine. Bottom, Data reported as mean amperometric current ± SEM in hDAT A559V cells expressed as a percentage of current recorded in hDAT cells, both for vehicle control conditions (n = 7) and with raclopride (n = 6) (t = 5.6, df = 11, p = 0.0002, Student's t test). B, Top, qPCR demonstrating the presence of endogenous D2R in HEK 293T cells. Traces from real-time PCR (top, left) and representative PCR gel (top, right) demonstrating that when RNA isolated from HEK 293T cells is reverse transcribed (+RT), PCR product crosses threshold near cycle 30 (arrow) (cT = 31.2 ± 0.1, n = 8), whereas if no reverse transcription is performed (−RT), no product reaches threshold (arrow). Middle, Representative immunoblot for D2R (top) and actin (bottom) in HEK 293T cells transfected with the indicated cDNA, confirming D2R expression. Mouse striatum, heavily enriched with endogenous D2R, was used as a positive control (n = 3). Bottom, Representative confocal images of single sections demonstrating that endogenous D2R and transfected hDAT are expressed in HEK 293T cells (upper row) and that cotransfection of hDAT and GFP leads to their coexpression (lower row). C, Top, Representative oxidative currents recorded from hDAT A559V cells pretreated for 4 h with vehicle control (left) or with 200 ng/ml PTX (right). Bottom, Data reported as mean amperometric current ± SEM in hDAT A559V cells expressed as a percentage of current in hDAT cells, both in vehicle control conditions (n = 3) and with PTX (n = 5) (t = 5.2, df = 6, p = 0.0019, Student's t test). D, Top, Representative oxidative currents in hDAT S/D cells [5 most distal hDAT N-terminal serines (Ser-2, Ser-4, Ser-7, Ser-12, and Ser-13) substituted by aspartates to mimic phosphorylated state] following pretreatment with vehicle (left) or 1 μm raclopride (right). Bottom, Data reported as mean amperometric current ± SEM in hDAT S/D cells, expressed as a percentage of current in hDAT cells both in control conditions (hDAT, n = 6; hDAT S/D, n = 6) and with raclopride (hDAT, n = 6; hDAT S/D n = 4) (t = 0.8, df = 8, p = 0.44, Student's t test). **p < 0.05.
Figure 2.
Figure 2.
D2R-mediated ADE is CaMKII-dependent in hDAT A559V cells. A, Representative immunoblot for autophosphorylated CaMKII, total CaMKII, and total DAT in hDAT and hDAT A559V cells. B, hDAT (n = 5) and hDAT A559V (n = 5) cell extracts were immunoblotted for CaMKII autophosphorylated at Thr-286 to measure CaMKII activity under basal conditions. The immunoprecipitated band densities were quantified, normalized to total CaMKII, and expressed as a percentage of autophosphorylated CaMKII in hDAT cells (t = 2.1, df = 8, p = 0.036, Student's t test comparing hDAT A559V to hDAT). C, Representative immunoblot for autophosphorylated CaMKII and total CaMKII following 20 min treatment with a 1 μm concentration of the D2R antagonist raclopride or vehicle control. D, hDAT A559V (n = 5) cell extracts were immunoblotted for autophosphorylated CaMKII with and without raclopride treatment. The immunoprecipitated band densities were quantified and normalized to the corresponding density of total CaMKII. Data reported as a percentage of vehicle control (t = 2.3, df = 8, p = 0.047, Student's t test). E, Top, Representative oxidative currents in hDAT A559V cells following 20 min pretreatment with vehicle (left), or a 5 μm concentration of the cell-permeable CaMKII peptide inhibitor, antCaMKIINtide (right). Arrows indicate addition of cocaine. Bottom, Data reported as mean amperometric current ± SEM in hDAT A559V cells expressed as a percentage of current recorded in hDAT cells both for control conditions (n = 6) and with antCaMKIINtide (n = 8) (t = 6.8, df = 12, p < 0.0001, Student's t test). Control peptide, ant-Tirap-R, has no effect on basal DA efflux in either hDAT A559V (n = 4) or hDAT cells (n = 4) (data not shown). F, Top, Representative oxidative currents in hDAT S/D cells following pretreatment with vehicle (left) or 5 μm antCaMKIINtide (right). Bottom, Data reported as mean amperometric current ± SEM in hDAT S/D cells expressed as a percentage of current in hDAT cells both in control conditions (n = 6) and with antCaMKIINtide (n = 5) (t = 0.7, df = 9, p = 0.48, Student's t test). *p < 0.05; **p < 0.01.
Figure 3.
Figure 3.
N-terminal phosphorylation of hDAT A559V supports ADE. A, Representative oxidative currents recorded from hDAT, hDAT A559V, and hDAT A559V S/A cells [5 most distal N-terminal serines (Ser-2, Ser-4, Ser-7, Ser-12, and Ser-13) substituted by alanine in A559V background to prevent phosphorylation]. Arrows indicate addition of cocaine. B, Data reported as mean amperometric current ± SEM from hDAT (n = 5), hDAT A559V (n = 6), and hDAT A559V S/A (n = 7) cells (F(2,15) = 18.2, p = 0.0005, **p < 0.01, one-way ANOVA followed by Bonferroni's multiple-comparison test). C, Representative immunoblot in hDAT and hDAT A559V cells for phosphorylated serines 7, 12, and 13 (pSer7, pSer12, and pSer13, respectively) and for total DAT. Inset, Immunoblot for D2R (top) and CaMKII (bottom) confirming their presence in Flp-In CHO cells; lanes are shown in duplicate (n = 6). D, Quantification of pSer DAT intensities normalized to total DAT. Data are reported as percentage of phosphorylation of pSer7, pSer12, and pSer13 in hDAT A559V with respect to hDAT (n = 5–7) (F(3,22) = 4.1, p = 0.018, *p < 0.05 **p < 0.01, one-way ANOVA followed by Dunnett's multiple-comparison test).
Figure 4.
Figure 4.
Phosphorylated DAT N terminus forms critical interactions that underlie the ability of A559V to cause ADE. A, Representative oxidative currents in hDAT A559V cells following whole-cell perfusion with vehicle (left) or a peptide corresponding to the first 27 residues of hDAT with the N-terminal serines substituted for aspartates (hDAT S/D peptide, right). Arrows indicate addition of cocaine. Cells were whole-cell patch clamped and perfused for 10 min to allow for loading of 2 mm DA and either 3 μm hDAT S/D peptide or vehicle control, and measured for ADE as described in Materials and Methods. B, Data reported as mean amperometric current ± SEM in hDAT A559V cells expressed as a percentage of current recorded in hDAT cells both in control conditions (n = 3) and with hDAT S/D peptide (n = 5) (t = 5.9, df = 6, p = 0.001, Student's t test). C, Representative oxidative currents in hDAT A559V cells following whole-cell perfusion with vehicle (left) or a peptide corresponding to the first 27 residues of hDAT with the N-terminal serines substituted for alanines (hDAT S/A peptide, right). Cells were whole-cell patch clamped and perfused as described above. D, Data reported as mean amperometric current ± SEM in hDAT A559V cells expressed as a percentage of current recorded in hDAT cells both in control conditions (n = 3) and with hDAT S/A peptide (n = 3) (t = 0, df = 4, p = 1.0, Student's t test). E, Representative oxidative currents in hDAT S/D cells following whole-cell perfusion with vehicle (left) or hDAT S/D peptide (right). Cells were whole-cell patch clamped and perfused as described above. F, Data reported as mean amperometric current ± SEM in hDAT S/D cells expressed as a percentage of current recorded in hDAT cells both in control conditions (n = 3) and with hDAT S/D peptide (n = 3) (t = 3.5, df = 4, p = 0.02, Student's t test). *p < 0.05; **p < 0.01.
Figure 5.
Figure 5.
D2R-stimulated hDAT A559V N-terminal phosphorylation promotes a channel-like mode of DAT. A, Representative traces of DAT-mediated channel-like activity in hDAT A559V, hDAT, hDAT A559V S/A, and hDAT S/D cells. hDAT A559V cells were also treated with raclopride (1 μm) and antCaMKIINtide (5 μm) as described above. Traces shown both for control condition (CTR) and after bath application of 10 μm cocaine (COC) to confirm DAT specificity. Isolated membrane patches were excised using the outside-out patch-clamp technique and held at −20 mV. B, Data were quantified using amplitude histogram analysis of 30 s of data to calculate the NPo of the DAT channel-like mode. For both CTR and COC conditions, data are reported as mean NPo ± SEM calculated for hDAT A559V cells (filled bars; n = 4), hDAT cells (open bars; n = 5), hDAT A559V S/A cells (sparse diagonal striped bars; n = 6), hDAT A559V cells pretreated for 20 min with 1 μm raclopride (dense diagonal striped bars; n = 4), hDAT A559V cells pretreated for 20 min with 5 μm antCaMKIINtide (sparse horizontal striped bars; n = 4), and hDAT S/D cells (dense horizontal striped bars; n = 5) (F(5,20) = 5.9, p = 0.0016, **p < 0.01, one-way ANOVA followed by Dunnett's test compared to hDAT A559V).
Figure 6.
Figure 6.
Expression of hDAT A559V in DAT-null DA neurons confers ADE properties. A, Inset, Mouse midbrain neuron expressing both red fluorescence (selection for DA neuron) and green fluorescence (successful transfection with DAT). Confocal image represents the merging (yellow) of both green and red fluorescence, indicating areas where both red and green fluorescence are dually expressed. Top, Representative oxidative currents in unloaded hDAT A559V-transfected neurons following 20 min pretreatment with vehicle (left), or 1 μm raclopride (right). Arrows indicate addition of cocaine. Bottom, Data reported as mean amperometric current ± SEM in hDAT A559V neurons expressed as a percentage of current recorded in hDAT neurons both for control conditions (n = 4) and with raclopride (n = 4) (t = 2.8, df = 6, p = 0.0327, Student's t test). B, Top, Representative oxidative currents in unloaded hDAT S/D-transfected neurons following 20 min pretreatment with vehicle (left) or 1 μm raclopride (right). Bottom, Data reported as mean amperometric current ± SEM in hDAT S/D neurons expressed as a percentage of current recorded in hDAT neurons both for control conditions (hDAT, n = 4; hDAT S/D, n = 3) and with raclopride (hDAT, n = 4; hDAT S/D, n = 3) (t = 1, df = 4, p = 0.37, Student's t test). C, Top, Representative oxidative currents in unloaded hDAT A559V-transfected neurons following 20 min pretreatment with vehicle (left) or 5 μm antCaMKIINtide (right). Bottom, Data reported as mean amperometric current ± SEM in hDAT A559V neurons expressed as a percentage of current recorded in hDAT neurons both for control conditions (n = 4) and with antCaMKIINtide (hDAT, n = 3; hDAT A559V, n = 4) (t = 2.9, df = 6, p = 0.0248, Student's t test). *p < 0.05.

References

    1. Bannon MJ. 2004. Dopamine. Nature Encyclopedia of Life Sciences, Nature Publishing Group. Retrieved May 15, 2008 from www.els.net.
    1. Bannon MJ, Sacchetti P, Granneman JG. The dopamine transporter: potential involvement in neuropsychiatric disorders. In: Watson SJ, editor. Psychopharmacology: the fourth generation of progress. Nashville, TN: The American College of Neuropsychopharmacology; 2000.
    1. Binda F, Dipace C, Bowton E, Robertson SD, Lute BJ, Fog JU, Zhang M, Sen N, Colbran RJ, Gnegy ME, Gether U, Javitch JA, Erreger K, Galli A. Syntaxin 1A interaction with the dopamine transporter promotes amphetamine-induced dopamine efflux. Mol Pharmacol. 2008;74:1101–1108. - PMC - PubMed
    1. Bolan EA, Kivell B, Jaligam V, Oz M, Jayanthi LD, Han Y, Sen N, Urizar E, Gomes I, Devi LA, Ramamoorthy S, Javitch JA, Zapata A, Shippenberg TS. D2 receptors regulate dopamine transporter function via an extracellular signal-regulated kinases 1 and 2-dependent and phosphoinositide 3 kinase-independent mechanism. Mol Pharmacol. 2007;71:1222–1232. - PubMed
    1. Carlsson A. Perspectives on the discovery of central monoaminergic neurotransmission. Annu Rev Neurosci. 1987;10:19–40. - PubMed

Publication types

MeSH terms

Substances