. 2010 Apr 28;30(17):6058-71.
doi: 10.1523/JNEUROSCI.3956-09.2010.

Aging-related gene expression in hippocampus proper compared with dentate gyrus is selectively associated with metabolic syndrome variables in rhesus monkeys

Affiliations

Aging-related gene expression in hippocampus proper compared with dentate gyrus is selectively associated with metabolic syndrome variables in rhesus monkeys

Eric M Blalock et al. J Neurosci. .

Abstract

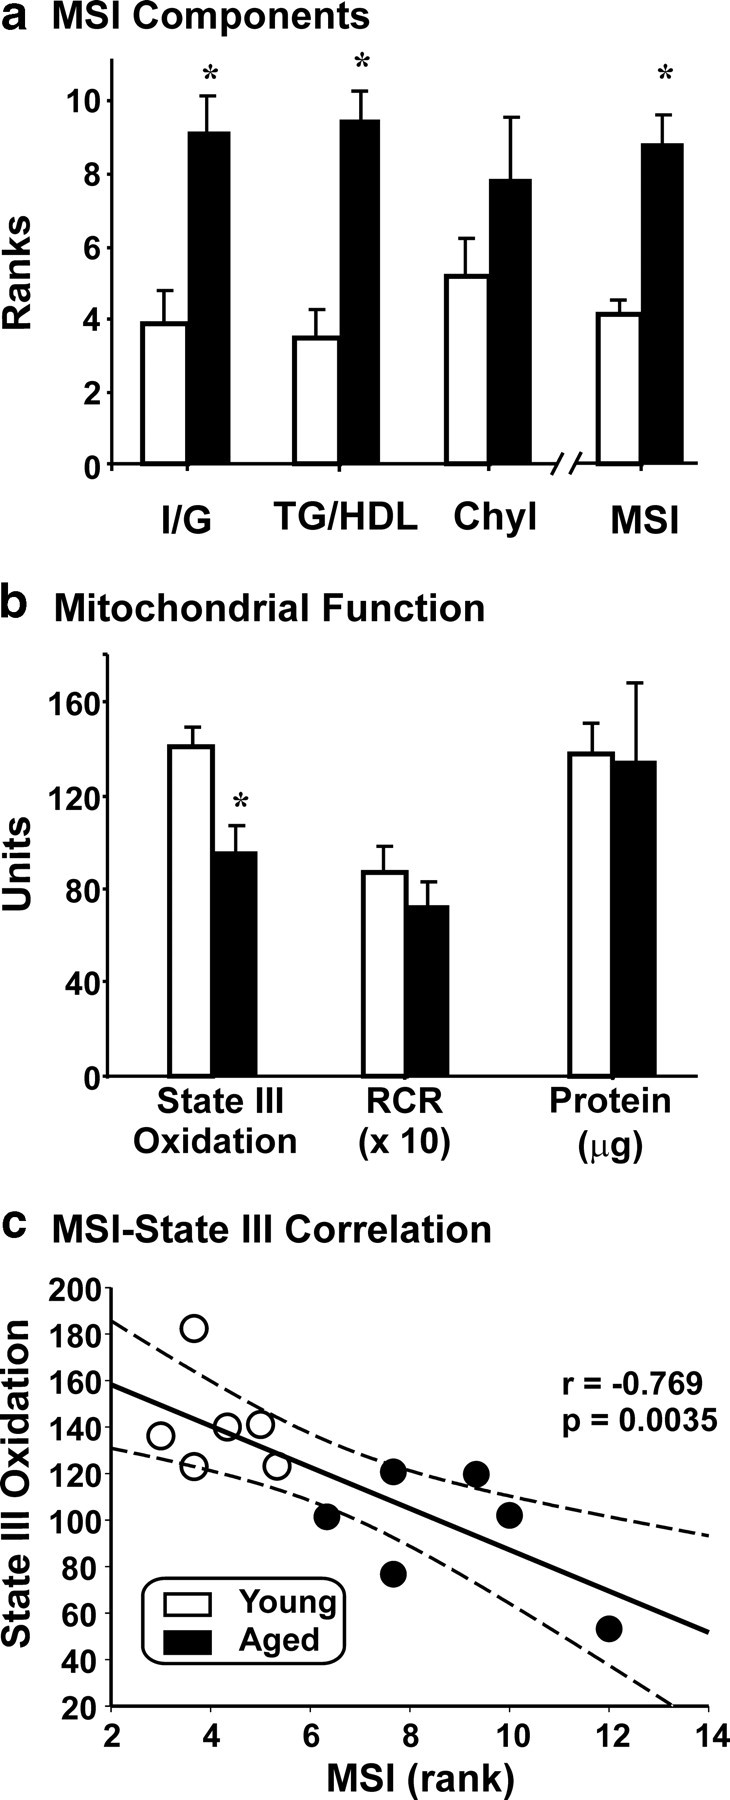
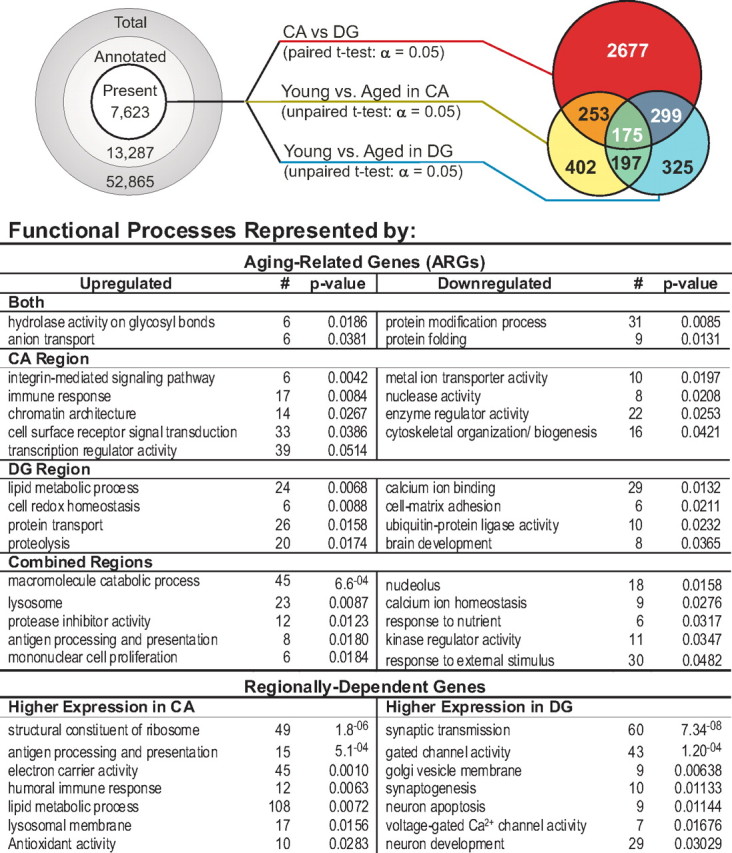
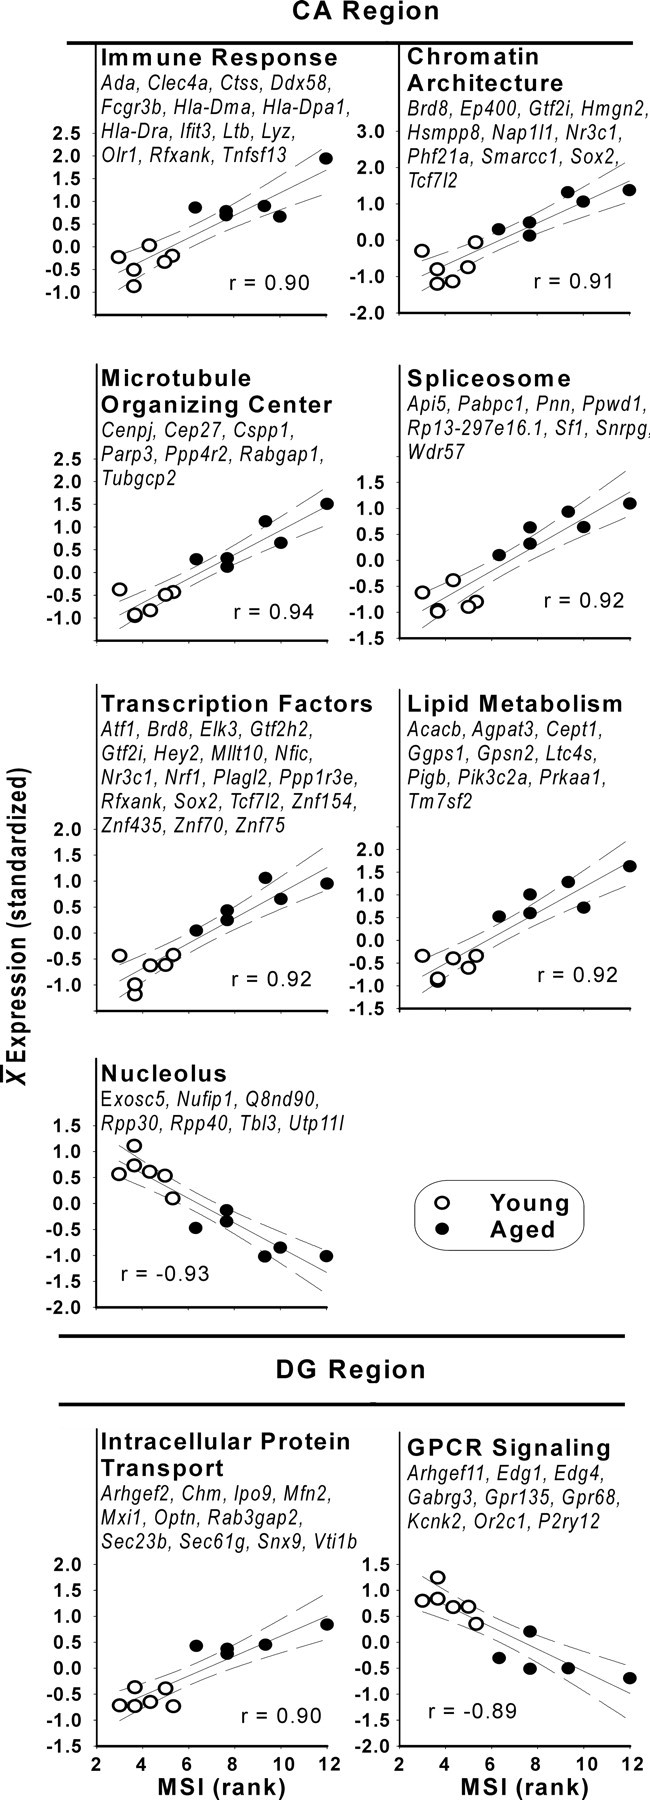
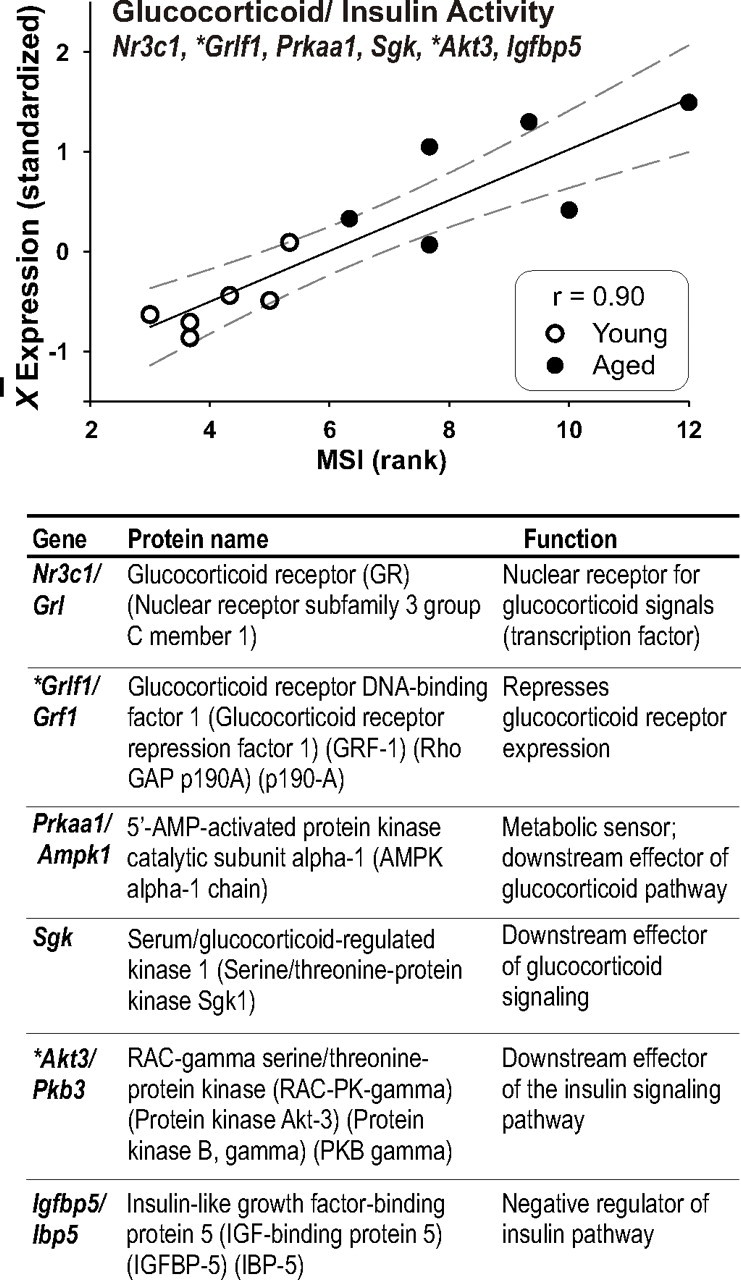
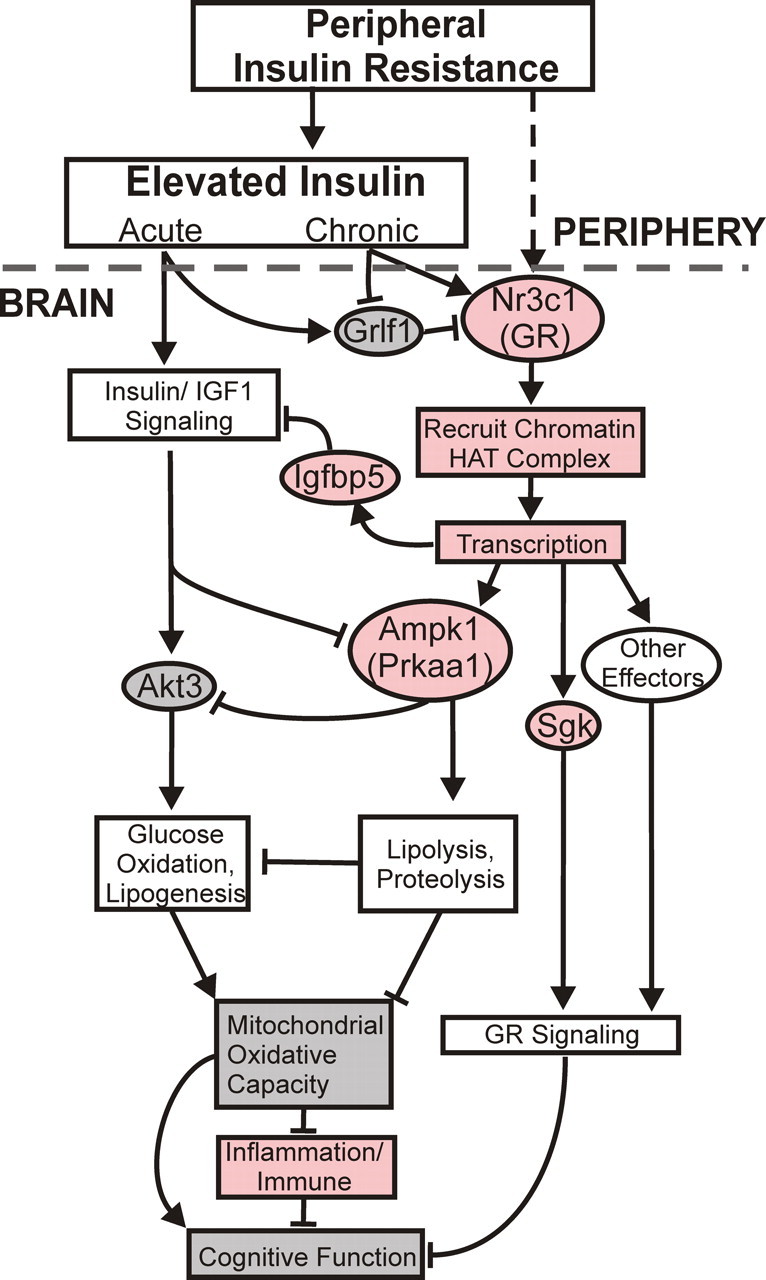
Age-dependent metabolic syndrome (MetS) is a well established risk factor for cardiovascular disease, but it also confers major risk for impaired cognition in normal aging or Alzheimer's disease (AD). However, little is known about the specific pathways mediating MetS-brain interactions. Here, we performed the first studies quantitatively linking MetS variables to aging changes in brain genome-wide expression and mitochondrial function. In six young adult and six aging female rhesus monkeys, we analyzed gene expression in two major hippocampal subdivisions critical for memory/cognitive function [hippocampus proper, or cornu ammonis (CA), and dentate gyrus (DG)]. Genes that changed with aging [aging-related genes (ARGs)] were identified in each region. Serum variables reflecting insulin resistance and dyslipidemia were used to construct a quantitative MetS index (MSI). This MSI increased with age and correlated negatively with hippocampal mitochondrial function (state III oxidation). More than 2000 ARGs were identified in CA and/or DG, in approximately equal numbers, but substantially more ARGs in CA than in DG were correlated selectively with the MSI. Pathways represented by MSI-correlated ARGs were determined from the Gene Ontology Database and literature. In particular, upregulated CA ARGs representing glucocorticoid receptor (GR), chromatin assembly/histone acetyltransferase, and inflammatory/immune pathways were closely associated with the MSI. These results suggest a novel model in which MetS is associated with upregulation of hippocampal GR-dependent transcription and epigenetic coactivators, contributing to decreased mitochondrial function and brain energetic dysregulation. In turn, these MSI-associated neuroenergetic changes may promote inflammation, neuronal vulnerability, and risk of cognitive impairment/AD.


Figures

Figure 1.
Figure 1.
Age-dependent metabolic and mitochondrial measurements. a, Age-related changes in peripheral metabolic measures. Ranked averages are plotted on the y-axis and separated for each metabolic measure and by age along the x-axis. Insulin/glucose ratio significantly increased with age (p = 0.009), as did triglyceride/HDL ratio (p = 0.002), whereas chylomicrons (Chyl) did not (p = 0.24). The combined peripheral MSI (see Materials and Methods) was highly significantly increased with age (p = 0.002; Mann–Whitney rank sum tests). b, Decreased hippocampal mitochondrial function with age. Protein extracted, RCR (see Materials and Methods), and mitochondrial state III oxidation (nanomoles of [O] consumed per milligrams of mitochondrial protein) are plotted as a function of age. No significant differences in protein or RCR (10× values for illustration) were found. The age-related reduction in state III oxidation (37%) was highly significant (*p = 0.009, Student's t test). c, Correlation between MSI and hippocampal mitochondrial state III oxidation. MSI (x-axis) is plotted against state III oxidation (y-axis) for each subject. Pearson's test revealed a strong, significant negative correlation between the blood measures and the central measures of mitochondrial activity (p = 0.0035; dotted gray lines, 95% confidence intervals).
Figure 2.
Figure 2.
Transcriptional profiling of aging and regional effects. Filtering and statistical results. Left, Prestatistical filtering steps, based on annotation grade and presence/absence call status (see Materials and Methods), reduced the total number of probe sets to be tested statistically from >50,000 to 7623. Middle, A total of 7623 probe sets were tested as follows: paired t test contrasting CA with DG regions and combining young and aged subjects (red line); unpaired t tests contrasting young versus aged subjects in the CA (gold) or DG (blue) regions. Right, Venn diagram describing overlap among significant genes (α = 0.05) on each test. Bottom, Functional processes associated with identified genes were determined using DAVID overrepresentation analysis (see Materials and Methods). Functional processes are separated by region and direction of change with age, and the number of genes populating that process in DAVID and the probability of that number being found by chance are shown.
Figure 3.
Figure 3.
Overlap of rhesus and rat hippocampal aging transcriptional signatures. Results of three rat hippocampal aging studies were consolidated and contrasted with results from the present rhesus microarray analyses (see Materials and Methods). Top, A total of 555 of 1541 genes changed significantly with age (p ≤ 0.05) in at least one of the three rat aging studies, whereas 404 of 1541 genes were significant (p ≤ 0.05) in the rhesus study. *p = 3.8−4, the number of genes that were significant and agreed in direction of change in both the consolidated rat and the rhesus studies was significant (binomial test). Right, Representative upregulated and downregulated genes from the overlap illustrate examples of genes altered by age consistently across studies. Bottom, Number of genes found divided by number of genes expected (e.g., at a p value cutoff of 0.05, 101 were found and 72 were expected; see Results) among 1541 genes present across all studies is plotted (y-axis) as a function of varying α (p value cutoffs; x-axis). Note the sharp increase in found/expected at α = 0.05 (shaded).
Figure 4.
Figure 4.
Functional processes overrepresented by MSI-correlated aging-related genes. Functional processes (with populating genes and p value for Fisher's exact test for overrepresentation) were identified from the list of MSI-correlated genes using DAVID overrepresentation analysis (see Materials and Methods) in both CA (top) and DG (bottom). To calculate an expression value for a functional process in a subject, each gene populating the process was individually standardized, and the average for all genes in that process was calculated for the subject. The standardized mean was plotted against the subject's MSI. Pearson's correlation value, linear fit (solid line), and 95% confidence intervals (dashed) are shown.
Figure 5.
Figure 5.
GC/insulin signaling strongly correlates with MSI in the CA region. Six aging-related genes associated with GC/stress and/or insulin/IGF1 signaling were used to construct a GC/insulin ratio that increases with elevated GC function and/or decreased insulin signaling. Top, Expression values for the six genes were averaged by subject [note that Grif, a downregulated repressor in the glucocorticoid pathway, and Akt3, a downregulated effector of the insulin pathway (*) were inverted before averaging]. The resulting GC/insulin ratio values correlated strongly (r = 0.9, Pearson's test) with the MSI. Bottom, Names and aliases of populating genes, as well as protein names and basic functions are listed.
Figure 6.
Figure 6.
Schematic model of putative MetS-induced alterations in glucocorticoid receptor/insulin signaling in the brain. Left, Acutely elevated peripheral insulin activates brain insulin signaling pathways mediated in part by AKT3, which increases glucose uptake and oxidation via mitochondrial oxidative processes, in turn enhancing cognitive function. Right, Abnormal peripheral metabolism (e.g., chronic hyperinsulinemia) associated with peripheral insulin resistance induces upregulation of the GR gene (Nr3c1) in hippocampus, which then recruits histone acetyltransferase complexes to chromatin to facilitate transcription of multiple GR targets, including Ampk1 and Sgk. Increased hippocampal expression of Ampk favors lipolysis and free fatty acid oxidation and blocks AKT-mediated glucose utilization. This results in decreased mitochondrial function, thereby activating inflammatory/immune pathways. Inflammation and reduced mitochondrial function combine with other GR-activated pathways to impair cognition and elevate risk of AD. Genes and processes found correlated with MSI in the present study are coded in light red if upregulated or gray if downregulated. Decreased cognitive function is inferred from the literature.

References

    1. Adeli K, Taghibiglou C, Van Iderstine SC, Lewis GF. Mechanisms of hepatic very low-density lipoprotein overproduction in insulin resistance. Trends Cardiovasc Med. 2001;11:170–176. - PubMed
    1. Andersen AH, Zhang Z, Zhang M, Gash DM, Avison MJ. Age-associated changes in rhesus CNS composition identified by MRI. Brain Res. 1999;829:90–98. - PubMed
    1. Arriagada PV, Growdon JH, Hedley-Whyte ET, Hyman BT. Neurofibrillary tangles but not senile plaques parallel duration and severity of Alzheimer's disease. Neurology. 1992;42:631–639. - PubMed
    1. Ashburner M, Ball CA, Blake JA, Botstein D, Butler H, Cherry JM, Davis AP, Dolinski K, Dwight SS, Eppig JT, Harris MA, Hill DP, Issel-Tarver L, Kasarskis A, Lewis S, Matese JC, Richardson JE, Ringwald M, Rubin GM, Sherlock G. Gene ontology: tool for the unification of biology. The Gene Ontology Consortium. Nat Genet. 2000;25:25–29. - PMC - PubMed
    1. Benjamini Y, Drai D, Elmer G, Kafkafi N, Golani I. Controlling the false discovery rate in behavior genetics research. Behav Brain Res. 2001;125:279–284. - PubMed

MeSH terms