

Review
doi: 10.2337/db09-1899.
Is the diminished incretin effect in type 2 diabetes just an epi-phenomenon of impaired beta-cell function?
Affiliations
- PMID: 20427697
- PMCID: PMC2857890
- DOI: 10.2337/db09-1899
Item in Clipboard
Review
Is the diminished incretin effect in type 2 diabetes just an epi-phenomenon of impaired beta-cell function?
Diabetes.
2010 May.
No abstract available
Figures
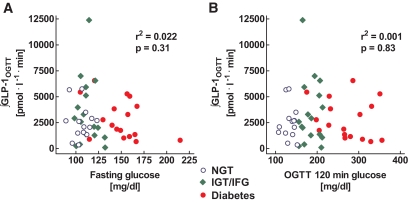
Relationship between the glucose concentrations at fasting (A) and 120 min after the ingestion of 75 g oral glucose (B) and the respective integrated GLP-1 levels measured over 240 min after oral glucose ingestion in 14 nondiabetic individuals (blue), 17 people with impaired glucose tolerance or impaired fasting glucose (green), and 17 patients with type 2 diabetes (red). Individual data were taken from ref. . r2 and P values were calculated by linear regression analyses. NGT, normal glucose tolerance; OGTT, oral glucose tolerance test.
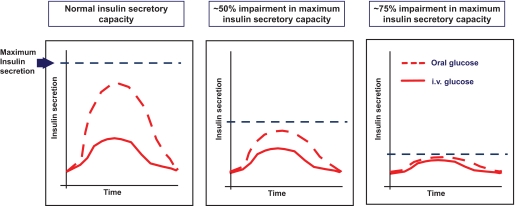
Hypothetical impact of a general impairment in β-cell function on the incretin effect: In individuals with a normal insulin secretory capacity, an oral glucose load elicits a much greater insulin secretory response than an intravenous (i.v.) glucose load. With a decreasing β-cell secretory capacity, the insulin response to the oral glucose load is relatively more diminished than the insulin response to intravenous glucose infusion. By these means, the incretin effect, i.e., the difference in the insulin responses to oral and intravenous glucose, diminishes with declining β-cell function. For details, see text.
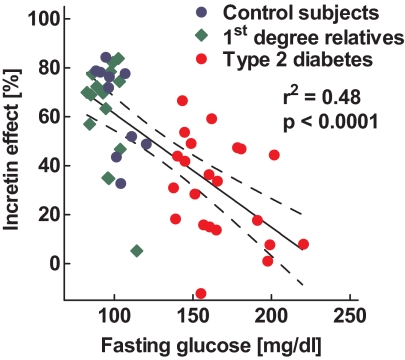
Relationship between the relative percentage contribution of the incretin effect on the overall insulin responses after oral glucose ingestion and to the respective fasting glucose concentrations in 48 individuals with and without diabetes. Individual data were taken from refs. and . The solid line denotes the regression line calculated by regression analyses in relation to the upper and lower 95% CIs.
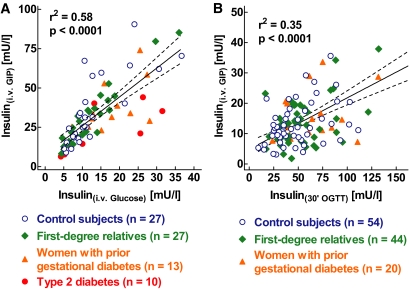
A: Relationship between the plasma insulin levels during the intravenous (i.v.) administration of glucose alone and the insulin levels during the combined administration of i.v. glucose and GIP in 27 healthy control subjects, 27 first-degree relatives of patients with type 2 diabetes, 13 women with previous gestational diabetes, and 10 patients with type 2 diabetes. Individual data were taken from refs. , , and . B: Relationship between the plasma insulin levels during the intravenous administration of GIP and glucose and the insulin levels measured 30 min after oral ingestion of 75 g glucose in 54 healthy control subjects, 44 first-degree relatives of patients with type 2 diabetes, and 20 women with previous gestational diabetes. Individual data were taken from refs. and . The solid line denotes the regression line calculated by regression analyses in relation to the upper and lower 95% CIs.
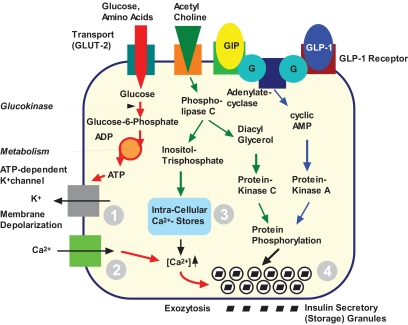
Intracellular actions of GIP and GLP-1 on the β-cell. Several cellular functions are affected: closing of the ATP-dependent potassium channel (1); calcium influx in response to action potentials (2); release of calcium from intracellular stores (3); and the readiness with which insulin storage granules are released (4), probably depending on protein phosphorylation. These effects are tightly linked to the glucose-dependent generation of ATP, meaning that GLP-1 and GIP augment insulin release only in the presence of hyperglycemia. For details, see ref. .
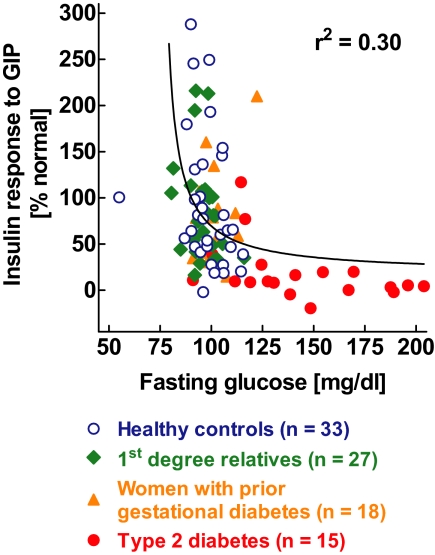
Relationship between the relative increase in insulin secretion during the intravenous administration of GIP at hyperglycemic clamp conditions and the respective fasting glucose concentrations in 93 individuals with and without diabetes. The relative increments in insulin secretion were expressed in relation to the mean values obtained in the individuals with normal glucose concentrations (fasting glucose levels <100 mg/dl). Individual data were taken from refs. , , and . The solid line denotes the regression line calculated by nonlinear regression analyses using an exponential decay function.
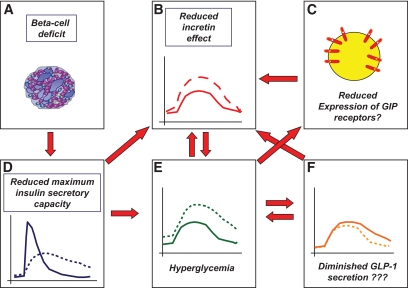
Working model for the diminished incretin effect in type 2 diabetes: The reduction in β-cell mass (A) leads to a significant impairment in the maximum insulin secretory capacity of the β-cells (D). The reduced secretory capacity leads to a preferential impairment of the relative insulin response to oral glucose, whereas a relatively normal insulin response to intravenous glucose (a comparably weaker β-cell stimulus) can still be maintained. The defects in β-cell function and the impaired incretin effect (B) lead to chronic hyperglycemia (E), which may diminish GLP-1 secretion (F) and impair GIP action through GIP-receptor downregulation (C), thereby further diminishing the incretin effect. Genetic factors may independently modify β-cell mass and function as well as GLP-1 secretion. Dashed lines in D, E, and F indicate the respective patterns typical of patients with type 2 diabetes, solid lines show the respective normal patterns. The dashed line in B illustrates the insulin levels after oral glucose ingestion; the solid line shows the respective patterns after isoglycemic intravenous glucose administration.
References
-
- Klöppel G, Löhr M, Habich K, Oberholzer M, Heitz PU. Islet pathology and the pathogenesis of type 1 and type 2 diabetes mellitus revisited. Surv Synth Pathol Res 1985;4:110–125 - PubMed
-
- Butler AE, Janson J, Bonner-Weir S, Ritzel R, Rizza RA, Butler PC. Beta-cell deficit and increased beta-cell apoptosis in humans with type 2 diabetes. Diabetes 2003;52:102–110 - PubMed
-
- Meier JJ, Butler PC. Insulin secretion. In Endocrinology 5th ed.DeGroot LJ, Jameson JL. Eds. Philadelphia, Elsevier Saunders, 2005, p. 961–973
-
- DeFronzo RA. Lily lecture 1987: The triumvirate: β-cell, muscle, and liver: a collusion responsible for NIDDM. Diabetes 1988;37:667–687 - PubMed
-
- Nauck M, Stöckmann F, Ebert R, Creutzfeldt W. Reduced incretin effect in type 2 (non-insulin-dependent) diabetes. Diabetologia 1986;29:46–52 - PubMed
Publication types
MeSH terms
Substances
LinkOut - more resources
Full Text Sources
Other Literature Sources
Medical
