. 2010 Apr 23;5(4):e10322.
doi: 10.1371/journal.pone.0010322.

Mapping brucellosis increases relative to elk density using hierarchical Bayesian models

Affiliations

Mapping brucellosis increases relative to elk density using hierarchical Bayesian models

Paul C Cross et al. PLoS One. .

Abstract

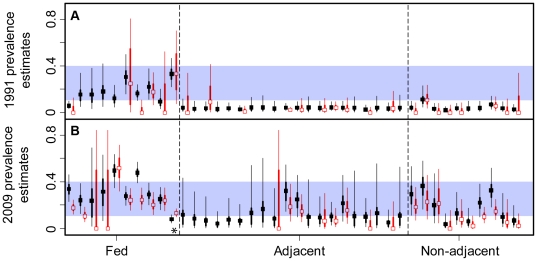
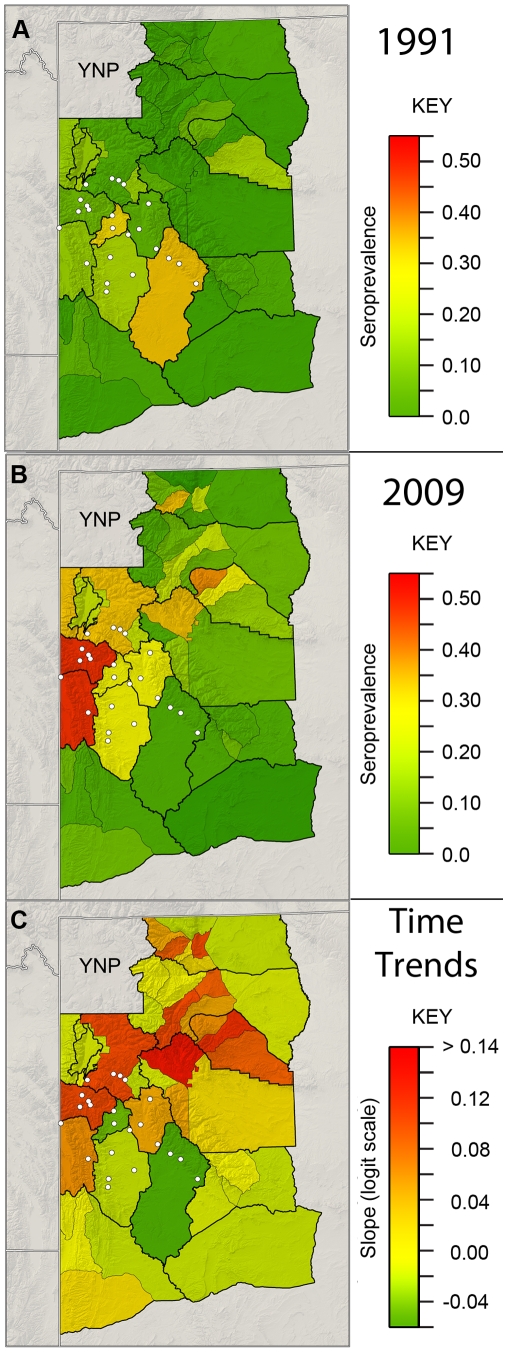
The relationship between host density and parasite transmission is central to the effectiveness of many disease management strategies. Few studies, however, have empirically estimated this relationship particularly in large mammals. We applied hierarchical Bayesian methods to a 19-year dataset of over 6400 brucellosis tests of adult female elk (Cervus elaphus) in northwestern Wyoming. Management captures that occurred from January to March were over two times more likely to be seropositive than hunted elk that were killed in September to December, while accounting for site and year effects. Areas with supplemental feeding grounds for elk had higher seroprevalence in 1991 than other regions, but by 2009 many areas distant from the feeding grounds were of comparable seroprevalence. The increases in brucellosis seroprevalence were correlated with elk densities at the elk management unit, or hunt area, scale (mean 2070 km(2); range = [95-10237]). The data, however, could not differentiate among linear and non-linear effects of host density. Therefore, control efforts that focus on reducing elk densities at a broad spatial scale were only weakly supported. Additional research on how a few, large groups within a region may be driving disease dynamics is needed for more targeted and effective management interventions. Brucellosis appears to be expanding its range into new regions and elk populations, which is likely to further complicate the United States brucellosis eradication program. This study is an example of how the dynamics of host populations can affect their ability to serve as disease reservoirs.


Conflict of interest statement

Competing Interests: The authors have declared that no competing interests exist.

Figures

Figure 1
Figure 1. Map of the study area.
In (A), the shading indicates the intensity of brucellosis testing among adult female elk in each hunt area. Broad and fine scale spatial analysis units (herd units and hunt areas, respectively) are shown along with the location of the 23 supplemental feeding grounds. Hashed regions did not have any disease test results. (B) The location of the study area within the United States.
Figure 2
Figure 2. Model-based estimates of brucellosis seroprevalence among adult female elk as a function of elk density at the hunt area scale.
The estimates for 1991 (A), 2009 (B) and the temporal trend (C) were based on the means of the predictive posterior distributions for Model 1 and were standardized by assuming all samples were from research captures. In (C), the temporal trend is on the logit scale, whereby {lower case alpha}j is the change in the log-odds of being test-positive in site j associated with a one-year increase in time. The wide and thin lines refer to the 50 and 95% credibility intervals, respectively. Red solid circles represent regions that contained supplemental elk feeding grounds. Regions without feeding grounds are represented by blue open circles.
Figure 3
Figure 3. The overall relationship between elk density and the annual rate that brucellosis is increasing on the logit scale for three of the top models.
The relationship is constrained to be linear (Model 1), a power function (Model 3) or a saturating type II response (Model 4). Thin lines are the 95% credibility intervals.
Figure 4
Figure 4. A comparison of model-based and raw data estimates of brucellosis seroprevalence among adult female elk.
Model estimates for 1991 (A) and 2009 (B) were based on the means of the predictive posterior distributions from Model 1 (black). Raw estimates were based on data from 1991–1994 (A) and 2006–2009 (B; red, offset to the right). Lines refer to the credibility and confidence intervals for the model and empirical estimates, respectively (wide lines  = [25–75], thin lines  = [2.5–97.5]). Fed areas were regions that included a supplemental elk feeding grounds. Adjacent areas shared a boundary with fed areas. Non-adjacent areas did not share a boundary with areas with feedgrounds. Model estimates were standardized by assuming all samples were from research captures. The asterisk marks the test-and-remove region and the empirical estimate was based only on 2009 data for that site. The blue rectangle highlights the range of seroprevalence estimates of fed regions in 1991, which included some regions without feedgrounds in 2009.
Figure 5
Figure 5. Maps of the brucellosis seroprevalence estimates for adult female elk and the annual trends.
The estimates for 1991 (A), 2009 (B) and the temporal trend (C) were based on the means of the predictive posterior distributions for Model 1 and were standardized by assuming all samples were from research captures. The temporal trend is on the logit scale. Supplemental feeding grounds are represented by white circles.

References

    1. Anderson RM, May RM. Oxford: Oxford University Press; 1991. Infectious Diseases of Humans: Dynamics and Control.757
    1. Hudson PJ, Rizzoli A, Grenfell BT, Heesterbeek H, Dobson AP. Oxford: Oxford University Press; 2001. The Ecology of Wildlife Diseases.197
    1. Kermack WO, McKendrick AG. Contributions to the mathematical theory of epidemics. Proceedings of the Royal Society of Edinburgh. 1927;115:700–721.
    1. Bartlett MS. Measles periodicity and community size. Journal of the Royal Statistical Society. 1957;120:48–71.
    1. Cauchemez S, Valleron A, Boëlle P, Flahault A, Ferguson NM. Estimating the impact of school closure on influenza transmission from sentinel data. Nature. 2008;452:750–754. - PubMed

Publication types