. 2010 Apr 23;5(4):e10269.
doi: 10.1371/journal.pone.0010269.

The fine tuning of pain thresholds: a sophisticated double alarm system

Affiliations

The fine tuning of pain thresholds: a sophisticated double alarm system

Léon Plaghki et al. PLoS One. .

Abstract

Two distinctive features characterize the way in which sensations including pain, are evoked by heat: (1) a thermal stimulus is always progressive; (2) a painful stimulus activates two different types of nociceptors, connected to peripheral afferent fibers with medium and slow conduction velocities, namely Adelta- and C-fibers. In the light of a recent study in the rat, our objective was to develop an experimental paradigm in humans, based on the joint analysis of the stimulus and the response of the subject, to measure the thermal thresholds and latencies of pain elicited by Adelta- and C-fibers. For comparison, the same approach was applied to the sensation of warmth elicited by thermoreceptors. A CO(2) laser beam raised the temperature of the skin filmed by an infrared camera. The subject stopped the beam when he/she perceived pain. The thermal images were analyzed to provide four variables: true thresholds and latencies of pain triggered by heat via Adelta- and C-fibers. The psychophysical threshold of pain triggered by Adelta-fibers was always higher (2.5-3 degrees C) than that triggered by C-fibers. The initial skin temperature did not influence these thresholds. The mean conduction velocities of the corresponding fibers were 13 and 0.8 m/s, respectively. The triggering of pain either by C- or by Adelta-fibers was piloted by several factors including the low/high rate of stimulation, the low/high base temperature of the skin, the short/long peripheral nerve path and some pharmacological manipulations (e.g. Capsaicin). Warming a large skin area increased the pain thresholds. Considering the warmth detection gave a different picture: the threshold was strongly influenced by the initial skin temperature and the subjects detected an average variation of 2.7 degrees C, whatever the initial temperature. This is the first time that thresholds and latencies for pain elicited by both Adelta- and C-fibers from a given body region have been measured in the same experimental run. Such an approach illustrates the role of nociception as a "double level" and "double release" alarm system based on level detectors. By contrast, warmth detection was found to be based on difference detectors. It is hypothesized that pain results from a CNS build-up process resulting from population coding and strongly influenced by the background temperatures surrounding at large the stimulation site. We propose an alternative solution to the conventional methods that only measure a single "threshold of pain", without knowing which of the two systems is involved.


Conflict of interest statement

Competing Interests: The authors have declared that no competing interests exist.

Figures

Figure 1
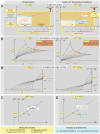
Figure 1. Theoretical analysis of nociceptive responses to heating.
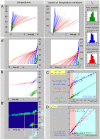
In this and the forthcoming Figures, the measurable variables are indicated with a yellow background while variables to be determined are indicated with a blue background. Individual curves of interest are shown in brown. Symbols, Abbreviations and Units can be found in table 1 . The psychophysical response R results mainly from a serial processing along the dedicated pathways involving successive time epochs. As proposed by Luce , we will reserve the term latency (L) to an unobserved hypothetical time. - A When skin is exposed to a constant source of radiant heat, the temperature T increases with the square root of time (left graph). It increases from the initial temperature T0 to the AT value, reached at the time of the reaction, according to the law of physics T = f(t) = T0+a*t0.5. By definition, the duration of this process is tR, the reaction time. Expressed in terms of squared temperature variations, this relationship becomes linear (right graph): [T(t)−T0)]2 = a2 *t = α.t. The time tR is organized sequentially in physical (Lϕ), biophysical (Lτ) and psychophysical (Lψ) latencies. Following a period of heating (Lϕ), heat is transduced by nociceptors into neuronal spikes (period Lτ), which in turn are transmitted toward, and received by, the CNS. Lp is the transit time for these spikes to reach the CNS. Ld is the “decision” time required by the CNS for interpreting and processing this information for an order to be sent to the motor system. Lm is the time required for a motor response to be triggered. Lϕ is completely dependent upon the heating rate and varies according to the experimental protocol. The other latencies are biological variables with Lτ≪Lp –, Lm≪Ld and Lψ = Lp+Ld+Lm. Four quantities are potentially accessible to experimental measurements: T0, AT, tR and α. - B Temporal evolution of the temperature of the skin during the application of thermal stimuli of various intensities. The stimulus is applied from time 0 till the response R of the subject. If one varies the power source of radiation, a series of measures can be made, including the heating of the skin from the initial temperature T0 up to the apparent threshold AT (left graph). The relationship AT = f(tR) (green curve) is an hyperbolic function with t = Lψ and T = Tψ as vertical and horizontal asymptotes respectively. In terms of squared temperature variations (right graph), the relationships are linear and the constant term α, slope of the straight lines, can be calculated. This term reflects the density of power of the heating source. The relationship ΔAT2 = f(tR) (green curve) is an hyperbolic function with t = Lψ and ΔT2 = ΔTψ2 as vertical and horizontal asymptotes respectively. - B’ One can modify the representation by adjusting the time scale of each individual curve for heating to the actual moment of the reaction. Such a change of origin allows one to visualize the back timing of events and to identify on the abscissa the point −Lψ and on the ordinate Tψ (left graph), or −Lψ and ΔTψ2 (right graph). Note that the latency artifact (AT−Tψ) increases with the stimulus intensity. - C Corresponding ΔAT2 = f(α) relationship. The intercept and the slope of this linear function represent ΔTψ2 and Lψ, respectively. From ΔTψ2, one can easily deduct the psychophysical threshold Tψ = T0+(ΔTψ2)0,5. - D Representation of the linear function tR = f(1/α) = Lψ+ΔTψ2 *(1/α). The intercept of the straight line with the ordinate gives the value of the psychophysical latency Lψ.
Figure 2
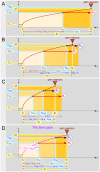
Figure 2. Consequences of the existence of a double afferent system (1).
The correctness of the hypothesis that the pain threshold is higher when triggered by Aδ-fibers than when triggered by C-fibers means that the response is triggered first by C-fibers (red arrows) then by Aδ-fibers (blue arrows) when one progressively increases the radiant heat power. Let us refer as to RC and RA for these two types of responses. - A For the lower stimulation powers that allow the skin temperature to reach TψC but not TψA., pain is triggered only by C-fibers following a delay LψC. - B There is then a small power range allowing the skin temperature to reach both TψC and TψA, with RC being triggered before RA. - C The higher stimulation powers allow the skin temperature to reach both TψC and TψA with pain being triggered first by the faster A-fibers following a delay LψA. This produces the classical “double pain”. - D The border case between situations described in B and C is characterized by pain being elicited at the very same time (R = RC+RA). This corresponds to a stimulation power characterized by a peculiar value of α we will refer as αAC. We will attribute the subscript “AC” and the purple color to the data corresponding to this particular situation.
Figure 3
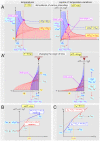
Figure 3. Consequences of the existence of a double afferent system (2).
The correctness of the hypothesis that the pain threshold is higher when triggered by Aδ-fibers than when triggered by C-fibers has other implications. - A When one considers the temporal evolution of the temperature of the skin during the application of thermal stimuli of various intensities, one must take into account the two afferent systems. The relationship AT = f(tR) comprises two components, namely ATA = f(tRA) and ATC = f(tRC), respectively. These are hyperbolic functions with t = LψA and t = LψC as vertical asymptotes and T = TψA and T = TψC as horizontal asymptotes, respectively. The respective domains of heating curves that provide responses elicited by Aδ- and C-fibers are shown as blue and red areas. The two components can be seen in terms of squared temperature variations (right graph). The relationship ΔAT2 = f(tR) are hyperbolic functions with t = LψA and t = LψC as vertical asymptotes and T = ΔTψA 2 and T = ΔTψC 2 as horizontal asymptotes respectively. In both graphs, the transition is determined by the borderline case (“AC”) represented in purple, for which the reaction is triggered at the very same moment by C- and Aδ-fibers (tRA = tRC = tRAC). - A’ One can predict the existence of two singular points of coincidence for the heating curves when these are settled on the reaction: the points of coordinates [−LψA, TψA] and [−LψC, TψC]. When the curves are linearized by expressing the results in terms of square of differences of temperature (right graph), these curves cross each other at two points of coordinates [−LψA, ΔTψA 2] and [−LψC, ΔTψC 2]. In both graphs, the transition is determined by the borderline case shown in purple. - B Corresponding ΔAT2 = f(α) relationships. The intercepts and the slopes of these 2 linear functions represent ΔTψA 2, ΔTψC 2 and LψA, LψC, respectively. From ΔTψA 2 and ΔTψC 2, one can easily deduct the psychophysical thresholds TψA = T0+(ΔTψA 2)0,5 and TψC = T0+(ΔTψC 2)0,5. - C The corresponding tR = f(1/α) relationships lead to the same values, the intercepts and the slopes of these 2 linear functions representing LψA, LψC and ΔTψA 2, ΔTψC 2, respectively.
Figure 4
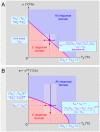
Figure 4. The question of Aδ- and C-fibers domains.
- A Respective domains of responses elicited by Aδ- (blue area) and C-fibers (red area) in the plane [T0, α]. These domains are separated by borderline cases characterized by the fact that reaction times and apparent thresholds are identical whatever the type of fibers triggering pain. This situation links the initial temperature T0 and the slope α by a particular relation:For a given T0, there is a corresponding αAC value beyond and below which, the reaction is triggered by Aδ- and C-fibers respectively (double arrow). The domain investigated in a given experimental series (dimmed area) is determined by the base temperature (here 26.8–31.6°C) and the window of used laser power (here 1.3–4.8 W) which generated a range of slope α (here 17–650°C2/s). - B Data as in A, but represented in the plane [T0, α2]. The ordinate represents the root square of α, that is a = α0.5. This presentation in terms of velocity of rising temperature (°C/s) is more concrete. The domain investigated in the present experiments ranged between 4.1 and 25.5°C/s.
Figure 5
Figure 5. Effects of stimulation of the dorsal part of the hand in a healthy subject.
For the sake of clarity, we have already attributed a color to these data on the basis of the classification defined below: blue and red for those that we believe attributable to the stimulation of nociceptive Aδ- and C-fibers, respectively (“pain test”) and green for those that we know were triggered by non-painful thermal stimulation (“warm test”). The stimulus (1–4.8 W range) was applied from time 0 until the withdrawal of the hand. - A Left graph: temporal evolution of the temperature of the skin recorded in the centre of the heating spot. Right graph: Identical data expressed in terms of square of the differences of temperature. All these linear relationships were highly significant and their slopes could therefore be computed confidently. The right insert shows for the three types of responses, the histograms of distribution of the initial baseline temperatures of the skin measured before the application of the laser stimuli. Each histogram is centered on the average and the theoretical normal distribution is superimposed. - A’ When one changes the origin to center the heating curves on the actual moment of the reaction, one can visualize the temporal evolution of the sequence of preceding events either in terms of temperature (left graph) or square of temperature variation (right graph). Note the clear tendency of these curves to cross each other in a privileged zone (open white circle). - B Cluster of intersections of the curves shown in A’ (left graph). - B’ The coordinates of the intersections of the curves shown in B were analyzed in terms of relative frequency distribution. The false colors represent the relative density of intersections. The highest probability of density of intersections was found at coordinates [−LψA = −0.265 s; TψA = 45.3°C], [−LψC = −0.870 s; TψC = 43.5°C] and [−LψA = −0.303 s; TψA = 33.3°C]. - C Calculation of the psychophysical thresholds Tψ by determination of intercepts. The figure groups together on a single graph - abscissa: slope α; ordinate: term (AT−T0)2 - all experimental points obtained with this subject during the two experimental sessions, namely the “pain” and “warm” tests. There was one and only one limit slope (αAC = 79.1, marked by a vertical dotted purple line), which decided between the points of the “pain test” in two groups. The intercept of these straight lines with the ordinate gave the values of ΔTψ2 from which one could deduct the value of the psychophysical thresholds TψA = 45.7°C (45.3–46.1) and TψC = 43.6°C (43.0–44.2). The corresponding analysis of the “warm test” gave the value TψW = 34.0°C (33.2–34.7). - D Calculation of the psychophysical latencies Lψ by determination of intercepts. The figure groups together all experimental points corresponding to the same experiments, but the abscissa is now the inverse of the slope α and the ordinate the reaction time tR. The intercept of these straight lines with the ordinate gave the values of the psychophysical latencies, LψA = 0.247 (0.178–0.317), LψC = 1.110 (0.735–1.484) and LψW = 0.392 (0.333–0.451) seconds. The red arrows indicate possibilities of anticipated responses.
Figure 6
Figure 6. Relationships between the initial temperatures of the skin and the thresholds.
Relationships between the initial temperatures of the skin and the thresholds: thermal threshold (in green), threshold of responses elicited by C- (in red) and Aδ-fibers (in blue). There was no correlation between the initial temperature of the skin and the threshold, no matter which type of fibers were triggering pain. On the other hand, the thermal threshold was very dependent on the initial temperature of the skin. A clear linear relationship was seen between the initial temperature of the skin and the threshold of heat detection (TψW = −2,677+1,207.T0; r2 = 0.948; F1–7 = 127.1; p<0.0001), which means that these subjects detected variations of temperature in the 2–3°C range.
Figure 7
Figure 7. Thresholds and latencies from various territories.
Six sites were investigated in this subject (front, hand, leg, foot) among which two belonged to the same dermatome on the lower limb (S1). - A Thresholds. The threshold TψA of the responses triggered by Aδ-fibers was 3–4°C higher than the thresholds TψC of the responses triggered by C-fibers. - B Psychophysical latencies. The latencies LψA of the responses triggered by Aδ-fibers were several times briefer than the latencies LψC of the responses triggered by C-fibers. The stimulation of two separate sites, the first distal on the foot (d) and the second proximal on the leg (p), allowed one to estimate the conduction velocity of the fibers responsible for the responses. The difference of the latencies of the responses attributed to Aδ-fibers was 0.059 seconds to travel the 430 mm (from d to p), which corresponds to a conduction velocity of 14.8 m/s. The difference of the latencies of the responses attributed to C-fibers was 1.395 seconds to go the same distance, which corresponds to a conduction velocity of 0.7 m/s.
Figure 8
Figure 8. Influence of the part of the body stimulated on the limit slope αAC.
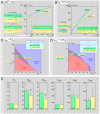
Three physical territories, with different distances to the Central Nervous System, namely forehead, hand and foot, were stimulated. The results from an individual subject are shown. - A Relationship (AT−T0)2 = f(α) allowing the determination of psychophysical thresholds Tψ and limit slopes αAC, marked by a dotted purple line. The highest thresholds were observed from the forehead and the limit slopes αAC were classified in the following order: foot < hand < forehead. - B Relationship tR = f(1/α) allowing the determination of the psychophysical latencies LψA (higher graph) and LψC (lower graph). They were classified in the following order: foot > hand > forehead. - C Curves which delimited in the plane [T0, a], the domains of obtaining responses triggered by Aδ- and C-fibers respectively (see Fig. 4); the purple full circles correspond to the values determined experimentally; curves are calculated from the TψC, TψA, LψC and LψA values, all determined experimentally.
Figure 9
Figure 9. Effects of heating on the psychophysical variables.
The whole dorsal surface of the hand was warmed to 38°C by means of an infrared lamp. - A Individual example. Relationship ΔAT2 = (AT−T0)2 = f(α) which allowed one to determine the psychophysical thresholds Tψ. A dotted purple line marks the limit slopes αAC that delineate the Aδ- from the C-response domains. The shift of the straight lines ΔAT2 = f(α) during heating is misleading because the base temperatures were very different. The heat indeed elicited an increase of TψC and TψA thresholds by about 3°C. - B Corresponding relationship tR = f(1/α) which allowed one to determine the psychophysical latencies Lψ. Note the variations of the slopes of the straight lines tR = f(1/α) following heating without any modification of the intercept with the ordinate, which means that the psychophysical latencies were not modified by heating. - C Curves in the plane [T0, α] which delimit the domains for obtaining responses triggered by Aδ- and C-fibers, respectively (see Fig. 4); the purple full circles correspond to the values determined experimentally. Curves are calculated from the TψCA, LψC and LψA values, all determined experimentally as the point of coordinates [T0, αAC]. One can see a shift of the respective domains of the responses elicited by Aδ- and C-fibers to the advantage of the latter. - D Identical results shown in the plane [T0, αAC 0.5]. E. Overall mean results regarding physical (T0) and psychophysical (TψA, TψC, LψA, LψC and αAC) variables (* = p<0.05; Wilcoxon-Mann-Whitney test).
Figure 10
Figure 10. Effects of capsaicin.
Presentation as in Fig. 9 (ABCD: individual example, E global data). - A Capsaicin elicited a downward shift of the straight lines ΔAT2 = (AT−T0)2 = f(α) and consequently a reduction of TψA (−2.4°C) and TψC (−4.9°C) thresholds because the base temperature T0 varied little. - B These effects resulted in corresponding variations of the slopes of the straight lines tR = f(1/α) without modification of the intercept with the ordinate, indicating that the psychophysical latencies were not modified by the treatment. - C & - D All these modifications were responsible for a shift of the respective domains of Aδ- and C- fibers to the advantage of the former and the latter for T0 below and above 39°C, respectively. The white lines exemplify a hypothetical case where the sensation in triggered by Aδ-fibers in the control situation and by C-fibers following capsaicin (see discussion). - E. Overall mean results regarding physical (T0) and psychophysical (TψA, TψC, LψA, LψC and αAC) variables (* = p<0.05; Wilcoxon-Mann-Whitney test).
Figure 11
Figure 11. Time-surface temperature thresholds for thermal injury of Human skin.
Relationship between exposure time (s) and skin surface temperature (°C) according to data from Moritz & Henriques . The solid line indicates the limit between absence of a thermal lesion and a first superficial degree of skin burn (hyperemic reaction). Data related to the hand from table 2 are added as red (threshold for C-fibers pain) and blue (threshold for Aδ-fibers pain) areas.
Figure 12
Figure 12. Example of thermal image of the skin recorded just before the pain response of the subject.
The warmest pixel Tmax of the scene reached 46.4°C. The spatial profiles of temperature are presented in the right (a) and above (b) the image. They correspond to the white dotted lines a and b drawn on the thermal image. The darkened zone at the top of these profiles corresponds to the 64 pixels which were used for the analysis of the temporal profiles; the average temperature of these 64 pixels is 46.1°C. The red dotted lines added to the black experimental curves are ideal Gaussian profiles. On such a picture, one can compare the radius of the stimulation spot with the radius of the laser beam. The radius of the beam is defined as the distance separating its z axis from the zone where its power was reduced to 1/e2 = 13.5% of its maximum. A corresponding radius of the stimulation spot resulted from these properties of the beam: the distance separating the z axis of the heating spot from the zone where the difference of temperature (T0−Tmax) was reduced to 13.5% of the maximum was indeed 10 mm. The related surface was ∼300 mm2 (∼3500 pixels).
Figure 13
Figure 13. Computation of the psychophysical threshold Tψ, latency Lψ and the limit slope αAC by a procedure based on a weighted least squares minimization criterion.
- A Principle of forced intersections (see text). - B Determination of the point of forced intersections for the “warm” responses exemplified in figure 5. - C Least squares minimization criterion allowing to determine the limit slope αAC applied to the “pain” responses exemplified in figure 5. - D Determination of the point of forced intersections for the A and C subgroups of psychophysical responses exemplified in figure 5.

References

    1. Nagasako EM, Oaklander AL, Dworkin RH. Congenital insensitivity to pain: an update. Pain. 2003;101:213–219. - PubMed
    1. Kavaliers M. Evolutionary and comparative aspects of nociception. Brain Res Bull. 1988;21:923–931. - PubMed
    1. Walters ET. Injury-related behavior and neuronal plasticity: an evolutionary perspective on sensitization, hyperalgesia, and analgesia. Int Rev Neurobiol. 1994;36:325–427. - PubMed
    1. Vriens J, Owsianik G, Voets T, Droogmans G, Nilius B. Invertebrate TRP proteins as functional models for mammalian channels. Pflugers Arch. 2004;449:213–226. - PubMed
    1. Dhaka A, Viswanath V, Patapoutian A. Trp ion channels and temperature sensation. Annu Rev Neurosci. 2006;29:135–161. - PubMed

Publication types