. 2010 Mar 19:4:1.
doi: 10.3389/neuro.11.001.2010. eCollection 2010.

Cortical hubs form a module for multisensory integration on top of the hierarchy of cortical networks

Affiliations

Cortical hubs form a module for multisensory integration on top of the hierarchy of cortical networks

Gorka Zamora-López et al. Front Neuroinform. .

Abstract

Sensory stimuli entering the nervous system follow particular paths of processing, typically separated (segregated) from the paths of other modal information. However, sensory perception, awareness and cognition emerge from the combination of information (integration). The corticocortical networks of cats and macaque monkeys display three prominent characteristics: (i) modular organisation (facilitating the segregation), (ii) abundant alternative processing paths and (iii) the presence of highly connected hubs. Here, we study in detail the organisation and potential function of the cortical hubs by graph analysis and information theoretical methods. We find that the cortical hubs form a spatially delocalised, but topologically central module with the capacity to integrate multisensory information in a collaborative manner. With this, we resolve the underlying anatomical substrate that supports the simultaneous capacity of the cortex to segregate and to integrate multisensory information.

Keywords: cortical hubs; corticocortical networks; integration; multisensory integration; segregation.


Figures

Figure 1
Figure 1
Schematic representation of the normalised matching index, computed as in Eq. 2. For proper comparison between pairs, the measure is normalised by the number of different neighbours of v and v′.
Figure 2
Figure 2
Weighted adjacency matrix W of the corticocortical connectivity of the cat comprising of L = 826 directed connections between N = 53 cortical areas (Scannell and Young, ; Scannell et al. , 1995). For visualisation purposes, the non-existing connections (0) have been replaced by dots. The network has clustered organisation, reflecting four functional subdivisions: visual (V), auditory (A), somatosensory-motor (SM) and frontolimbic (FL).
Figure 3
Figure 3
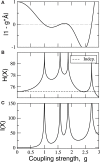
Parametric study of the linear System (6) using the cortical network of the cat. (A) Integrability range. When the determinant |1 − gÂ| = 0 the system has a pole. Negative values lead to non-physical solutions. (B) Entropy and (C) Integration diverge around the poles.
Figure 4
Figure 4
Covariance matrix of the cat cortical network as a linear system. The adjacency matrix has been previously normalised by 1/λmax and the noise level set to ξi = 1.0. Coupling strengths are: (A) g = 0.52, (B) g = 0.84 and (C) g = 0.92.
Figure 5
Figure 5
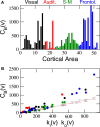
Centrality of cortical areas. (A) Betweenness of cortical areas shows that at each sensory system few areas are very central. (B) Comparison between CB of cortical areas and the expected centrality due to their degree (brown line). As a consequence of the modular and hierarchical organisation of the network, low degree areas closely follow the expected centrality but hubs are significantly more central than expected. Communication paths between sensory systems are centralised through the hubs.
Figure 6
Figure 6
Rich-club organisation. (A) k-density of the corticocortical network of the cat ϕcat, compared to the expectation out of the surrogate ensemble {𝒢1n}. The largest difference occurs at k = 23 (vertically dashed line) giving rise to (B) a rich-club composed of 11 areas.
Figure 7
Figure 7
Topological similarity of cortical areas. (A) Pairwise matching index MI(v,v′) for all areas summarised in matrix form. Self-matching MI(v,v) is ignored for visualisation. (B) Distribution of the MI values in (A) if the areas v and v′ are in the same anatomical module V, A, SM or FL (dashed line), and if they belong to different modules (solid line). (C) Recomputed distribution of MI if the areas belong to different modules, but cortical hubs are discarded (solid line). And distribution of MI(v,v′) only if v and v′ are hubs in the Rich-Club (dotted line).
Figure 8
Figure 8
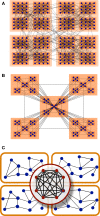
Hierarchical organisation of complex networks. (A) Hierarchies as agglomeration of modules (Arenas et al., 2006). (B) Centralised and fractal hierarchical model (Ravasz and Barabási, 2003). (C) Illustrative representation of the modular and hierarchical structure found in the corticocortical connectivity of the cat. The highest hierarchical level is formed by a densely interconnected overlap of the modules.
Figure 9
Figure 9
Functional segregation and integration. (A) Local integration I(S) of cortical hubs after stimulation of the primary sensory areas. (B) Co-participation matrix of cortical hubs within the subsets leading to large Ie(S) (red dots). (C) Modular integration I𝒫4 of the sensory modules V, A, SM and FL after simultaneous lesion of cortical hubs. NS is the number of hubs removed. (D) Co-participation matrix of the hubs within the subsets S which lead to a larger decrease in the dynamical dependence (I𝒫4(S)) of the sensory modules (marked by red dots).
Figure 10
Figure 10
Spatial location of the areas according to their modality: visual (yellow), auditory (red), somatosensory-motor (green) and frontolimbic (blue). While areas of similar modality tend to lie close to each other (A), the hubs form a topological cluster which is spatially delocalised (B).

References

    1. Anthonisse J. M. (1971). The rush in a directed graph. Technical Report BN9/71. Amsterdam, Stichting Mathematisch Centrum
    1. Arenas A., Díaz-Guilera A., Pérez-Vicente C. (2006). Synchronization reveals topological scales in complex networks. Phys. Rev. Lett. 96, 114102.10.1103/PhysRevLett.96.114102 - DOI - PubMed
    1. Bear M. F., Connors B. W., Paradiso M. A. (2006). Neuroscience: Exploring the Brain. Baltimore, MD, Lippincott Williams and Wilkins
    1. Bressler S. L., Kelso J. A. S. (2001). Cortical coordination dynamics and cognition. Trends Cogn. Sci. 5, 26–3610.1016/S1364-6613(00)01564-3 - DOI - PubMed
    1. Bullmore E., Sporns O. (2009). Complex brain networks: graph theoretical analysis of structural and functional systems. Nat. Rev. Neurosci. 10, 1 - PubMed