

A simple method for measuring signs of (1)H (N) chemical shift differences between ground and excited protein states
- PMID: 20428928
- PMCID: PMC3034452
- DOI: 10.1007/s10858-010-9418-8
A simple method for measuring signs of (1)H (N) chemical shift differences between ground and excited protein states
Abstract
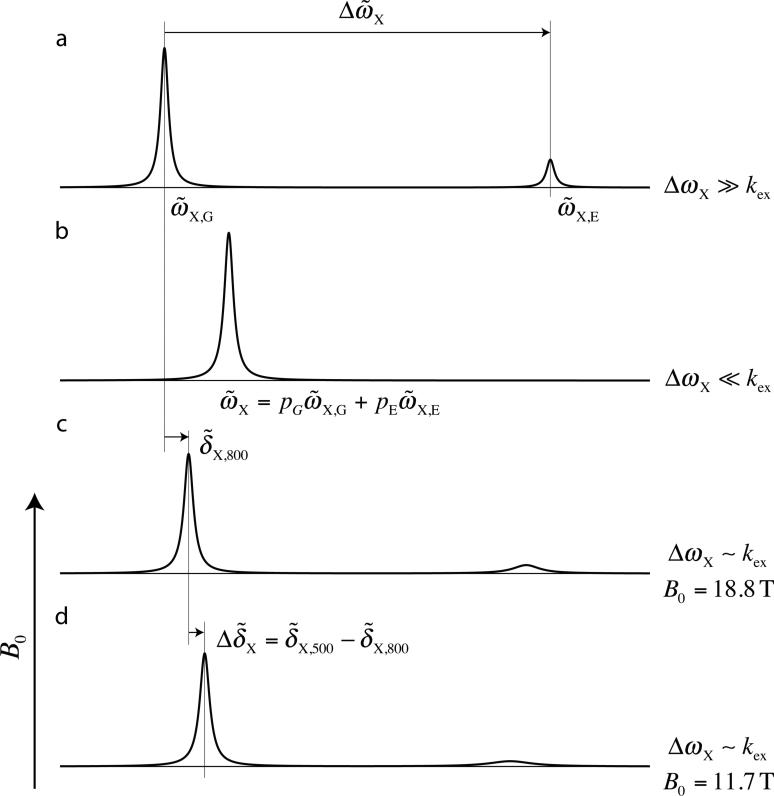
NMR relaxation dispersion spectroscopy is a powerful method for studying protein conformational dynamics whereby visible, ground and invisible, excited conformers interconvert on the millisecond time-scale. In addition to providing kinetics and thermodynamics parameters of the exchange process, the CPMG dispersion experiment also allows extraction of the absolute values of the chemical shift differences between interconverting states, /Delta(omega)/, opening the way for structure determination of excited state conformers. Central to the goal of structural analysis is the availability of the chemical shifts of the excited state that can only be obtained once the signs of Delta(omega) are known. Herein we describe a very simple method for determining the signs of (1)H(N) Delta(omega) values based on a comparison of peak positions in the directly detected dimensions of a pair of (1)H(N)-(15)N correlation maps recorded at different static magnetic fields. The utility of the approach is demonstrated for three proteins that undergo millisecond time-scale conformational rearrangements. Although the method provides fewer signs than previously published techniques it does have a number of strengths: (1) Data sets needed for analysis are typically available from other experiments, such as those required for measuring signs of (15)N Delta(omega) values, thus requiring no additional experimental time, (2) acquisition times in the critical detection dimension can be as long as necessary and (3) the signs obtained can be used to cross-validate those from other approaches.
Figures
References
-
- Anet FAL, Basus VJ. Limiting equations for exchange broadening in two-site NMR systems with very unequal populations. Journal of Magnetic Resonance. 1978;32:339–343.
-
- Auer R, Hansen DF, Neudecker P, Korzhnev DM, Muhandiram DR, Konrat R, Kay LE. Measurement of signs of chemical shift differences between ground and excited protein states: a comparison between H(S/M)QC and R (1rho ) methods. J Biomol NMR. 2009a - PubMed
-
- Auer R, Neudecker P, Muhandiram DR, Lundstrom P, Hansen DF, Konrat R, Kay LE. Measuring the signs of 1H(alpha) chemical shift differences between ground and excited protein states by off-resonance spin-lock R(1rho) NMR spectroscopy. J Am Chem Soc. 2009b;131:10832–10833. - PubMed
-
- Boehr DD, McElheny D, Dyson HJ, Wright PE. The dynamic energy landscape of dihydrofolate reductase catalysis. Science. 2006;313:1638–1642. - PubMed
-
- Carr HY, Purcell EM. Effects of Diffusion on Free Precession in Nuclear Magnetic Resonance Experiments. Phys Rev. 1954;94:630–638.
Publication types
MeSH terms
Substances
Grants and funding
LinkOut - more resources
Full Text Sources
